The most common misconception about Core Web Vitals is that they are a single number you can pass once and forget. In practice, they are a distribution of user experiences, measured in the field, across real devices and network conditions. A lab test on your laptop with a throttled CPU tells you almost nothing about what your actual visitors are experiencing.
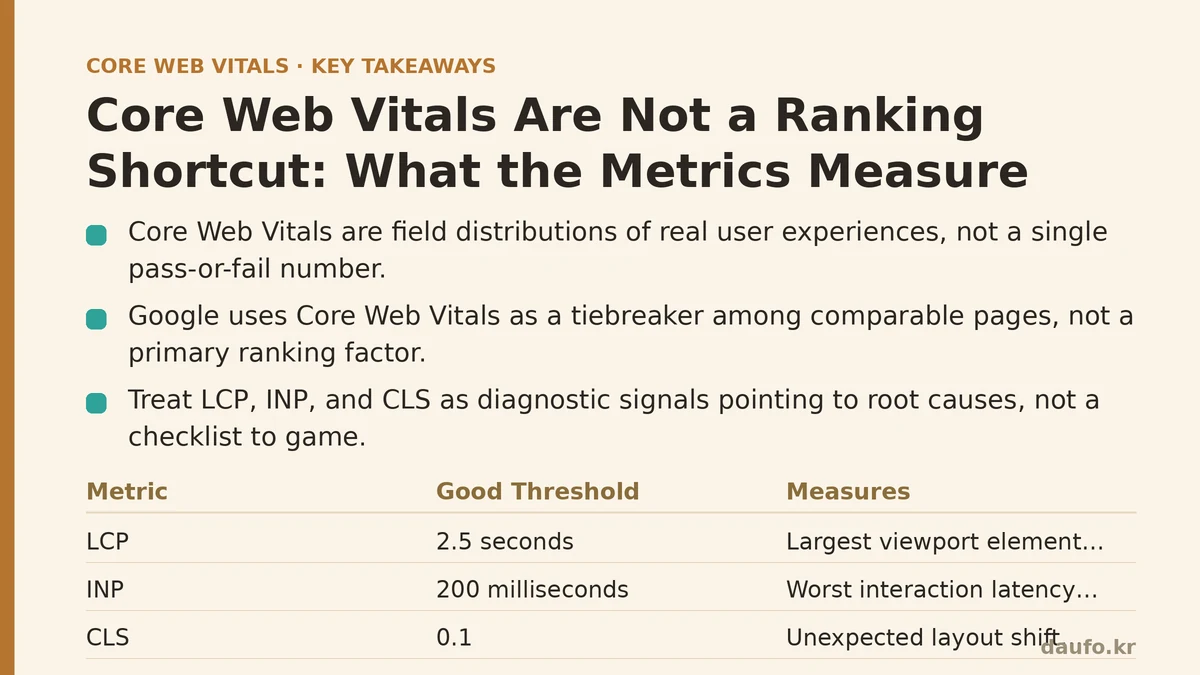
Core Web Vitals are not a ranking shortcut. Google uses them as a tiebreaker among otherwise comparable pages, not as a primary ranking factor. But more importantly, they are a diagnostic system. If you treat LCP, INP, and CLS as signals that point to specific root causes, you will build faster pages. If you treat them as a checklist to game, you will chase your tail.
This guide takes two paths through the same terrain. The beginner path explains what each metric means and how to interpret it. The advanced path dissects the technical pipeline behind each metric, including failure modes and the trade-offs of common fixes.
Beginner Path: The Three Metrics Explained
Largest Contentful Paint (LCP)
LCP measures the time from when the user initiates navigation until the largest content element in the viewport is rendered. That element is usually a hero image, a heading, or a video poster. The threshold is 2.5 seconds for “good” and 4.0 seconds for “poor.”
The common pitfall here is assuming LCP is only about image loading time. It is not. LCP is about the critical rendering path from the browser’s perspective. That includes:
- Time to First Byte (TTFB) from the server
- Render-blocking CSS and JavaScript
- How quickly the image resource is discovered and fetched
- Whether the image is preloaded or lazy-loaded (lazy-loading an LCP image is a known mistake)
Interaction to Next Paint (INP)
INP became the official replacement for First Input Delay (FID) in March 2024. FID only measured the delay between a user’s first interaction and the browser’s ability to process that interaction. INP measures the latency of every interaction across the page’s lifespan and reports the worst one (excluding outliers).
The 200-millisecond threshold separates good from poor. The metric captures the entire interaction pipeline:
- Input delay (the browser is busy doing something else)
- Processing time (the event handler runs)
- Presentation delay (the next frame is painted)
For beginners, the fastest way to improve INP is to reduce long tasks on the main thread. A long task is any JavaScript execution block that runs for more than 50 milliseconds. Break those up and you will see INP improve.
Cumulative Layout Shift (CLS)
CLS measures visual stability. It sums the impact of all unexpected layout shifts that occur during the page’s lifecycle. The score is computed as the product of two factors: the fraction of the viewport that shifted (impact fraction) and the distance the elements moved (distance fraction).
A shift only counts if it is unexpected. User-initiated shifts, like opening a menu or resizing a page, do not count. The threshold is 0.1 for good.
The three most common CLS culprits are:
- Images or embeds without explicit width and height dimensions
- Content injected above existing content (banners, ads, cookie notices)
- Web fonts that cause a layout shift when swapped in
Advanced Path: The Technical Pipeline Behind the Metrics
LCP: Beyond the Image Tag
The LCP pipeline has four distinct phases, and optimizing each one requires a different tool.
Phase 1: Server response time (TTFB). If your server takes 800ms to respond, you have already used almost a third of your LCP budget. Use a CDN with edge caching to serve static assets from a location close to the user. For dynamic content, consider streaming the HTML head early or using server-side rendering with fine-grained caching.
Phase 2: Render-blocking resources. The browser cannot paint anything until it has fetched and parsed all render-blocking CSS and deferred JavaScript. To audit this, open DevTools, run a performance trace, and look at the “FCP” marker. If there is a large gap between TTFB and FCP, you have render-blocking issues. Inline critical CSS above the fold and load the rest asynchronously.
Phase 3: Resource load time for the LCP element. Once the browser has parsed the HTML, it needs to discover the LCP resource. If that resource is loaded via a CSS background image or a lazy-loaded <img>, you have introduced a delay. Use <link rel="preload"> for the LCP image so the browser starts fetching it immediately, and never apply loading="lazy" to an element you expect to be the LCP candidate.
Phase 4: Element render delay. Even after the image bytes arrive, the browser must decode and render them. For extremely large images, this decode can take hundreds of milliseconds. Serve images in modern formats like WebP or AVIF at the correct display size, not the source size.
Here is a concrete implementation path for LCP, from setup to verification.
# Step 1: Identify your current LCP element and its load phases.
# Run Lighthouse in headless mode to get a lab-based LCP score.
npx lighthouse https://example.com --only-categories=performance --output=json --output-path=./lighthouse.json

# Step 2: Parse the JSON to find the LCP element and its timing breakdown.
# Look for the "largest-contentful-paint-element" audit details.
node -e "
const report = require('./lighthouse.json');
const audit = report.audits['largest-contentful-paint-element'];
console.log(JSON.stringify(audit.details.items, null, 2));
"
That command will show you which element is the LCP candidate and the exact phases where time is being spent. If the “fetchStart” to “loadTime” delta is large, the image is not preloaded. Fix it in your HTML:
<link rel="preload" as="image" href="/hero.webp" fetchpriority="high">
<img src="/hero.webp" width="1200" height="628" alt="Hero image" fetchpriority="high" decoding="async">
Note the trade-off: fetchpriority="high" tells the browser to prioritize this image over other resources. Use it only on the LCP element. Applying it to multiple images defeats the purpose.
Verification step. Re-run Lighthouse and compare the LCP phase breakdown. You should see the “discovery” and “load” times shrink. But lab numbers only tell you so much. Move to field data for the next level of verification.
INP: Finding the Long Tasks That Matter
INP is a field-first metric. You can estimate it in the lab with DevTools CPU throttling, but the real distribution comes from Real User Monitoring (RUM). The Web Vitals JavaScript library is the standard tool for collecting this data.
import {onINP} from 'web-vitals';

onINP(({value, rating, entries}) => {
  // value is the INP in milliseconds (or null if not available)
  // entries contains all interaction entries; inspect the worst one
  console.log(`INP: ${value} ms (${rating})`);

  // The worst interaction's event handler duration
  for (const entry of entries) {
    const handlerTime = entry.processingEnd - entry.processingStart;
    if (handlerTime > 50) {
      console.warn(`Long interaction handled: ${handlerTime} ms`);
    }
  }
});
Once you have the worst interaction, use DevTools’ Performance panel to record a trace and locate the long task that preceded it. The fix is usually one of three:
- Reduce the amount of JavaScript executed during the handler. If a click handler triggers a complex computation, move that computation to a Web Worker. This works for data processing but not for DOM updates.
- Break long tasks with
awaitandsetTimeout(0). This yields control back to the browser so it can paint frames between chunks of work. - Use
content-visibility: autoon off-screen sections. This keeps the browser from rendering below-the-fold content immediately, freeing the main thread for interactions.
Critical failure mode to avoid: adding event listeners to high-frequency interactions like scroll or mousemove that trigger expensive layout reads. Wrap them in a requestAnimationFrame throttle and separate the read from the write. Reading offsetTop or similar forced reflow properties inside a long task will inflate INP measurably.
CLS: The Dependency Chain Problem
CLS is the only metric that does not involve timing. It is a layout geometry calculation. The advanced issue here is not fixing a single shift; it is identifying which resource’s late arrival caused the shift in the first place.
The Subhead approach fails often because teams add width and height to images but forget:
- The font swap: when
font-display: swaploads a webfont with a different cap height than the fallback, text lines shift. - The injected ad slot: an ad iframe that renders after the page has loaded will push content down.
- The cookie banner that slides in from the top, pushing your header and hero down.
A diagnostic workflow:
// Collect all CLS entries in real time to find the shifting element
import {onCLS} from 'web-vitals';

onCLS(({entries}) => {
  for (const entry of entries) {
    const change = entry.sources[0];
    console.log(`Node shifted: ${change.node?.className || change.node?.tagName}`,
                `DeltaX: ${change.previousRect.x - change.currentRect.x}`,
                `DeltaY: ${change.previousRect.y - change.currentRect.y}`);
  }
});
The most robust fix for dyamic content injection is a two-step approach: reserve space during layout using CSS aspect-ratio or min-height, and only inject content into that reserved space. If the injected content is smaller than the reserved space, you get whitespace instead of a shift. That is the trade-off: visual stability at the cost of empty space.
For fonts, use font-display: optional if the font is decorative and not critical for reading. This tells the browser to skip the font entirely if it has not loaded by the time the page renders, preventing any swap-induced shift.
The Field vs. Lab Gap: Why You Need Both
Lab measurements (Lighthouse, PageSpeed Insights with a simulated environment) are deterministic and repeatable. They let you debug a single issue. Field data (CrUX, RUM) reflects the real distribution of user experiences.
The problem: Lighthouse runs on a simulated mid-range mobile device with throttled network. It does not capture the 4G connection that drops packets, the phone with a background video call consuming CPU, or the user who interacts with a page before it finishes loading. Field data captures all of that.
Here is a workflow that closes the gap:
- Audit in the lab to find the root cause. Run Lighthouse, inspect the phase breakdowns, and apply fixes.
- Deploy and collect field data. Use the Web Vitals library to send INP, CLS, and LCP to your analytics endpoint. Wait at least a week to gather a meaningful sample size.
- Compare against CrUX. The Chrome User Experience Report (CrUX) gives you aggregated field data for your origin. You do not need to own the site to query it. Use the CrUX API (requires an API key) or the PageSpeed Insights API to pull the 75th percentile of LCP, INP, and CLS.
- Fix the new discrepancies. If CrUX reports poor LCP but Lighthouse says good, the gap is usually in TTFB or network conditions. Look at your server logs for slow regions or uncached pages.
# Query the CrUX API for your origin's field data
curl -s "https://chromeuxreport.googleapis.com/v1/records:queryRecord?key=YOUR_API_KEY" \
  -H "Content-Type: application/json" \
  -d '{"origin":"https://example.com"}' | jq '.record.metrics'
That command returns histogram data for LCP, INP, and CLS. The 75th percentile is the number you should report to stakeholders, because that is the threshold Google uses. If the 75th percentile of INP is 250ms, then one in four users has a poor experience. That is not a minor edge case.
When to Ignore the Core Web Vitals Advice
Not every optimization is worth the trade-off. Here are three scenarios where you should slow down and think twice.
1. Your LCP element is a character-decode-bound text block. If your LCP is a massive block of text served via a slow CMS, optimizing the image pipeline will not help. The bottleneck is TTFB and server-side rendering. Consider static site generation or edge caching. If that is not possible, accept a borderline LCP score and focus on INP and CLS instead.
2. You have a single-page app with complex state management. Moving every state update off the main thread is impractical. Instead, isolate the expensive code paths. Use React’s useTransition or Vue’s nextTick to defer non-critical updates. Only the worst interaction counts for INP, so you need to shave a few of the heaviest user flows, not every single one.
3. Your ad network injects unpredictable content. You cannot control what an ad iframe renders. The content-visibility: auto trick works, but it only postpones the layout shift; it does not eliminate it. Reserve a fixed-height slot for ads and accept the whitespace penalty. That is the only reliable way to keep CLS below 0.1 when third-party code is involved.
The goal of Core Web Vitals is not to make your site perfect. It is to make the experience consistent enough that users do not notice the loading process at all. That means targeting the 75th percentile, not the median, and not the 99th. When you optimize for the edges, you over-engineer for a minority and sacrifice the experience for the majority.
Summary: Core Web Vitals as a System, Not a Scorecard
| Metric | What It Measures | Beginner Threshold | Advanced Root Cause | Primary Fix |
|---|---|---|---|---|
| LCP | Time to render the largest block | 2.5s | TTFB, render-blocking resources, image discovery | Preload LCP image, inline critical CSS, use a CDN |
| INP | Worst interaction latency | 200ms | Long tasks on the main thread, expensive event handlers | Break long tasks, offload to Web Workers, throttle listeners |
| CLS | Visual stability (unexpected shifts) | 0.1 | Missing dimensions, font swap, dynamic injection | Reserve space with aspect-ratio, use font-display: optional |
The system works only if you feed it field data. Your own users are the best source of truth. Instrument the Web Vitals library today, wire it to your analytics, and let the 75th percentile of real traffic drive your next optimization sprint. The metrics will tell you where to look; they will not tell you what to build. That part is still your job.
Related guides: The Chrome UX Report Doesn’t Measure Your Users, and Other Truths About Field Data, Common Core Web Vitals Mistakes Developers Make (And How to Fix Them), and Why Your Core Web Vitals Score Fluctuates: Troubleshooting Common Measurement Errors.
🔗 Recommended Reading
- How to Enable Browser Caching on Your Website: A Beginner's Step-by-Step Tutorial
- Web Performance Monitoring Tools Compared: Lighthouse, PageSpeed Insights, and WebPageTest
- CDN vs. Origin Server: Which to Optimize First for Latency
- Common Mistakes That Break Web Font Performance and How to Fix Them
- Site Speed Optimization for Fintech Websites: Balancing Security, Compliance, and Performance