
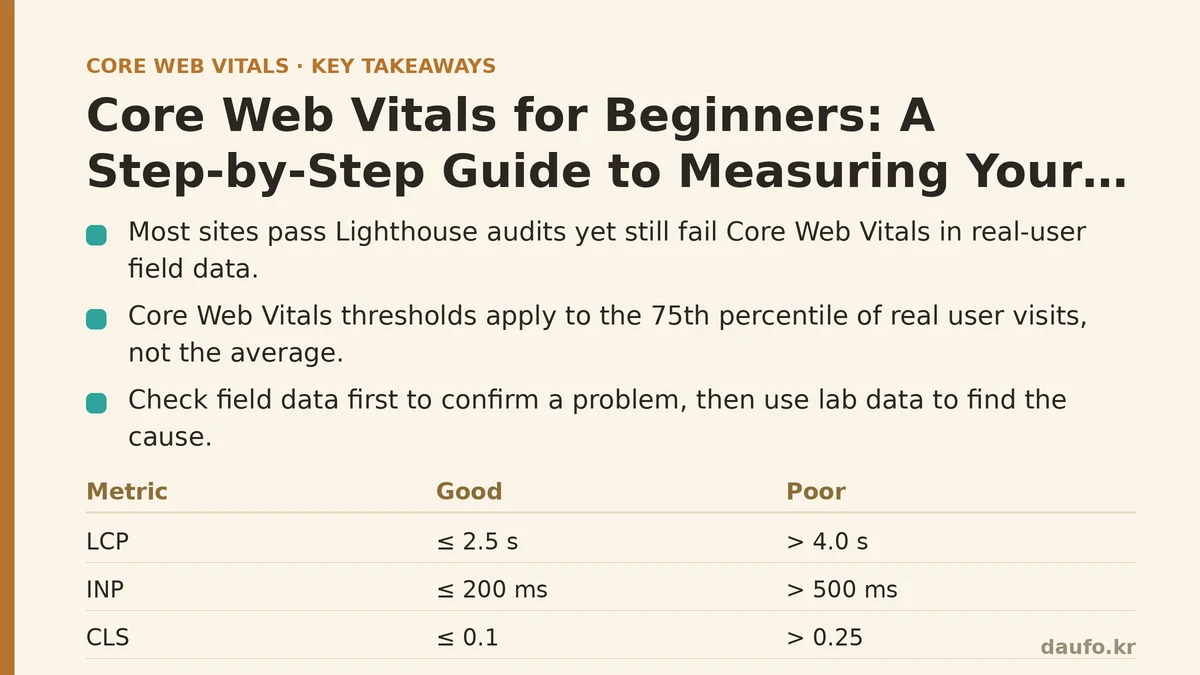
Most sites pass a Lighthouse audit and still fail Core Web Vitals in the field. That gap confuses a lot of beginners, and it is the single biggest reason a “green score” can coexist with a red flag on the same page. The two numbers measure different things under different conditions, and once you understand why they diverge, running your first audit becomes a much more grounded exercise.
This walkthrough follows one concrete scenario — auditing a single landing page on a mid-sized content site — from setup through verification. The general advice is woven into the steps rather than listed separately, because the decisions only make sense in context.
Step 1: Understand What You Are Auditing Before You Open a Tool
Core Web Vitals is a set of three metrics that measure distinct parts of the user experience:
- Largest Contentful Paint (LCP) — how long until the largest visible element (usually a hero image or heading) renders. This is a loading metric.
- Interaction to Next Paint (INP) — how long the page takes to visually respond to a user interaction. This is a responsiveness metric.
- Cumulative Layout Shift (CLS) — how much the page’s layout jumps around unexpectedly. This is a visual stability metric.
Google publishes thresholds for each. Treat these as the pass/fail boundaries for your audit:
| Metric | Good | Needs Improvement | Poor |
|---|---|---|---|
| LCP | ≤ 2.5 s | 2.5 s – 4.0 s | > 4.0 s |
| INP | ≤ 200 ms | 200 ms – 500 ms | > 500 ms |
| CLS | ≤ 0.1 | 0.1 – 0.25 | > 0.25 |
The critical detail beginners miss: these thresholds apply to the 75th percentile of real user visits, not the average. A site can have a great median LCP and still fail because a quarter of sessions are slow. That framing matters for everything that follows.
Step 2: Decide Which Data Source Answers Your Question
There are two families of measurement, and mixing them up is the most common beginner mistake.
- Lab data — a single synthetic run in a controlled environment. Tools like Lighthouse and the Chrome DevTools Performance panel produce this. It is reproducible and good for debugging why something is slow, but it is not what your users experience.
- Field data — aggregated, anonymized measurements from real visitors. This comes from the Chrome User Experience Report (CrUX) and your own RUM tooling. This is the data Google uses to rank pages.
For the landing page in this walkthrough, the right move is to check field data first to confirm there is a problem, then use lab data to find the cause. Going straight to Lighthouse on a fast office machine tells you almost nothing about a mobile visitor on a spotty connection.
Step 3: Pull Field Data From the CrUX API
CrUX data is available through the PageSpeed Insights web interface, but if you want to automate the check or pull it on a schedule, the CrUX API is a simple REST endpoint. The request below queries origin-level data for a single URL.
curl -s "https://chromeuxreport.googleapis.com/v1/records:queryRecord?key=YOUR_API_KEY" \
  --header 'Content-Type: application/json' \
  --data '{
    "url": "https://example.com/landing-page",
    "formFactor": "PHONE",
    "metrics": [
      "largest_contentful_paint",
      "interaction_to_next_paint",
      "cumulative_layout_shift"
    ]
  }'
The response returns percentiles including p75. That p75 value is the number you compare against the threshold table above — not the average, not the median. If p75 LCP comes back at 3.1 s, the page fails LCP for mobile users, and you have a clear target to work on.
A few things to know about CrUX as a data source
- It has a latency of roughly 28 days. Changes you ship today will not appear in CrUX data for weeks. Do not use CrUX to verify a fix.
- Low-traffic URLs may return no data. CrUX only reports when there is enough sample volume. For long-tail pages, you need your own RUM.
- It is origin-level by default, but URL-level data exists. The
urlfield above requests URL-level; omit it to get the whole origin.
If the origin passes but a specific URL fails, or vice versa, you are looking at two different problems, and the fix will be local to a template rather than the whole site.
Step 4: Reproduce the Problem in the Lab
Once field data confirms an issue, open Chrome DevTools and go to the Lighthouse tab. Run a mobile audit with throttling enabled. This simulates a slower device and network, which is where most LCP problems hide.
The goal here is not the score. The goal is the diagnostics section at the bottom of the report. For an LCP failure, look for:
- Largest Contentful Paint element — Lighthouse names the specific DOM node that is the LCP candidate. This tells you whether you are optimizing the wrong image.
- Render-blocking resources — CSS and synchronous
<script>tags that delay first paint. - Properly size images and Serve images in modern formats — this is where oversized hero images usually surface.
If the LCP element turns out to be a large JPEG served at 2400px wide but displayed at 800px, you have found the cause in under a minute. That is the value of lab data: it points at the specific element, not just the number.
Step 5: Apply One Fix and Verify It Properly
Suppose the audit points to the hero image as the LCP element and flags it as oversized. The fix has two parts: serve the image at an appropriate size, and serve it in a modern format.
<picture>
  <source
    srcset="/images/hero-800.avif 800w,
            /images/hero-1600.avif 1600w"
    sizes="(max-width: 800px) 100vw, 800px"
    type="image/avif">
  <source
    srcset="/images/hero-800.webp 800w,
            /images/hero-1600.webp 1600w"
    sizes="(max-width: 800px) 100vw, 800px"
    type="image/webp">
  <img
    src="/images/hero-800.jpg"
    width="800"
    height="450"
    fetchpriority="high"
    alt="Product hero">
</picture>
Three details in that snippet matter more than the rest:
srcsetwithwdescriptors lets the browser pick the smallest file that fits the layout slot. Serving one giant image to every device is the most common LCP mistake.widthandheightattributes on the<img>reserve layout space before the image loads, which prevents the shift that would otherwise add to CLS.fetchpriority="high"tells the browser to prioritize this specific image over other resources. Use it sparingly — if you mark everything high priority, nothing is.
Verifying the fix
Because CrUX lags by weeks, you cannot verify with field data on the day you ship. Two better options:
- Re-run the Lighthouse audit with the same mobile throttling settings and confirm the LCP element now has a smaller estimated load time. This confirms the change is live and correct, not that the user-facing metric improved.
- Use the DevTools Performance panel to record a fresh page load and check the LCP marker position on the timeline. This isolates the loading path from cache effects better than a re-run of Lighthouse on a warm cache.
To confirm the field metric eventually moves, set a calendar reminder for four to six weeks out and re-query CrUX. Anything less than that is measuring noise.
Step 6: Watch for These Beginner Failure Modes
A first audit goes wrong in predictable ways. None of them are exotic.
- Optimizing the score instead of the metric. A 100 Lighthouse score on desktop does not mean mobile users are happy. Always run mobile with throttling for the LCP and INP portions of the audit.
- Testing only the homepage. The failing page is often a template — a product page, a blog post, a category listing — not the root. Field data will tell you where to look.
- Treating INP as something Lighthouse catches well. Lighthouse runs a single synthetic load with no user interaction, so INP cannot be meaningfully measured in the lab the way LCP can. INP requires field data or manual interaction traces in the DevTools Performance panel with a real recording.
- Ignoring the 75th percentile. Averages hide the users who are suffering. If you only look at the mean, you will pass when a quarter of visits are slow.
- Assuming one fix closes the audit. LCP, INP, and CLS fail for different reasons. A fast LCP does not help CLS caused by an ad slot that injects late.
When This Approach Is the Wrong Fit
The step-by-step above assumes a site with enough traffic to have CrUX data and a small set of representative pages worth auditing. That will not always be the case.
- If your site has very low traffic, CrUX will return no data for most URLs. You need to instrument RUM yourself — a small script that reports
web-vitalslibrary measurements back to your analytics endpoint — and wait a few weeks for volume. - If you are auditing a single-page application, lab tools often miss client-side navigations. You need RUM with route-change tracking, because a client-rendered route change produces no new CrUX entry.
- If your site is behind authentication, CrUX will not have data for the gated pages at all. RUM is the only path.
In all three cases, the threshold table and the p75 framing still apply — you are just swapping the data source. The measurement philosophy does not change; only the plumbing does.
Start with one page, use field data to choose it, and let the audit end when the p75 numbers cross into the good column — not when a green circle appears.
Related guides: The DOM Size Myth: Why ‘Fewer Divs’ Isn’t the Real Performance Fix, Mastering Script Loading: A Deep Dive into Async vs. Defer for Peak Performance, and HTTP Request Priority Isn’t What You Think: How Browsers Really Decide What Loads First.
🔗 Recommended Reading
- How to Enable Browser Caching on Your Website: A Beginner's Step-by-Step Tutorial
- Web Performance Monitoring Tools Compared: Lighthouse, PageSpeed Insights, and WebPageTest
- CDN vs. Origin Server: Which to Optimize First for Latency
- Common Mistakes That Break Web Font Performance and How to Fix Them
- Site Speed Optimization for Fintech Websites: Balancing Security, Compliance, and Performance