Say you are trying to fix a “Poor” INP score flagged in Search Console. The report tells you the metric is bad, and it might even point to a specific page template. What it does not tell you is which of the dozen scripts running on that page is responsible, or why a button click that feels instant on your development machine takes 400 milliseconds to respond on a mid-range Android phone.
This is the frustrating part of Interaction to Next Paint (INP). Unlike a layout shift you can visually spot, or an image that obviously takes too long to load, INP problems live inside the main thread’s execution timeline. You cannot see them without opening the right tools and knowing what you are looking for.
This guide is structured as a troubleshooting checklist. For each common symptom, we will walk through the likely cause and the concrete fix. Work through it in order, since the issues near the top tend to have the biggest impact on real-world scores.
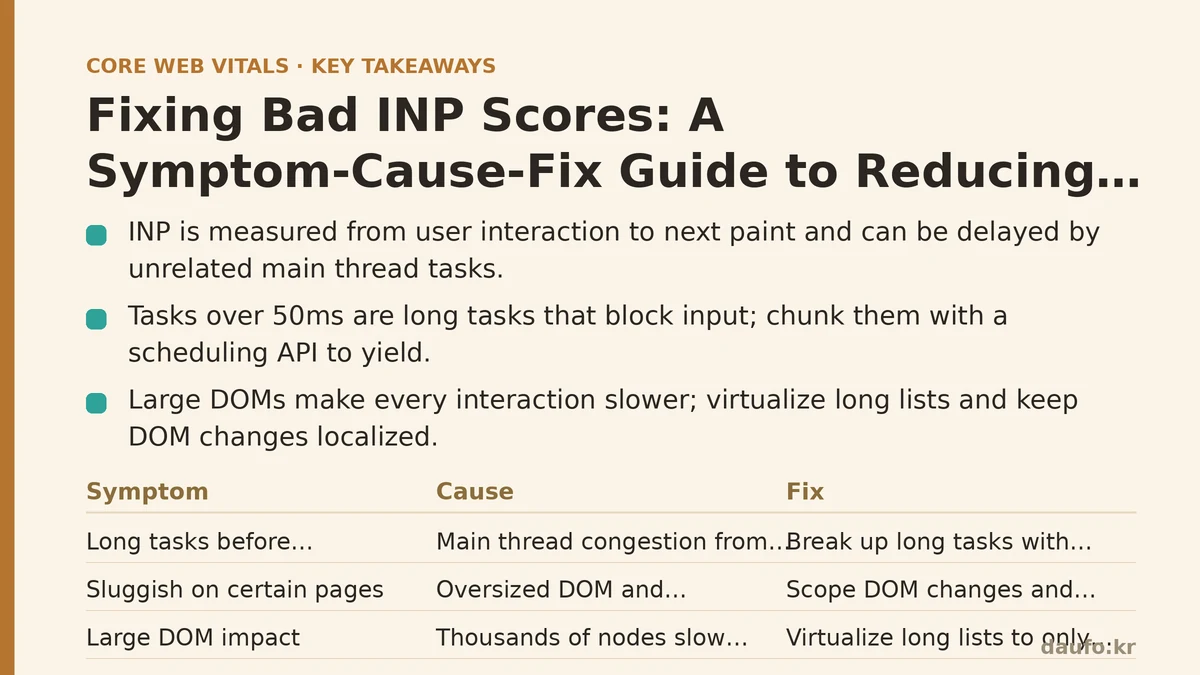
Symptom: The Performance Panel Shows Long Tasks Before the Interaction Even Happens
You open Chrome DevTools, go to the Performance panel, record a click, and notice something odd: the input delay (the gap between the click and when your event handler starts) is huge, but your actual click handler runs quickly.
Cause: Main Thread Congestion from Unrelated Work
INP is not only about how fast your click handler executes. It is measured from the moment the user interacts to the moment the next frame is painted. If the main thread is busy running something unrelated — a third-party analytics script, a background data-processing loop, a large JSON.parse() call — when the user clicks, the browser cannot even start your handler until that unrelated task finishes.
This is the single most common cause of poor INP on content-heavy sites, and it is frequently invisible in synthetic Lighthouse audits because those don’t simulate real user interaction timing under load.
Fix: Break Up Long Tasks
Any JavaScript task that runs for more than 50ms is classified as a “long task” and blocks the main thread from responding to input. The fix is to chunk large synchronous operations into smaller pieces using a scheduling API.
// Before: one long, blocking task
function processLargeArray(items) {
  items.forEach(item => heavyComputation(item));
}

// After: yield to the main thread between chunks
async function processLargeArrayInChunks(items) {
  for (let i = 0; i < items.length; i++) {
    heavyComputation(items[i]);
    if (i % 20 === 0) {
      await new Promise(resolve => setTimeout(resolve, 0));
      // Or, in supporting browsers:
      // await scheduler.yield();
    }
  }
}
Yielding periodically gives the browser a chance to process pending input and paint updates before your script resumes.
Symptom: Clicking a Button Feels Sluggish, But Only on Certain Pages
You test the same UI component on a simple page and it feels instant. On a page with a complex dashboard or a long product listing, the identical component feels laggy.
Cause: An Oversized DOM Combined with Expensive Style Recalculations
A large DOM (thousands of nodes) doesn’t just slow down initial rendering. It slows down every subsequent interaction, because any DOM mutation your click handler triggers — adding a class, toggling visibility, updating text — can force the browser to recalculate styles and layout for a much larger tree than necessary.
This shows up in the Performance panel as “Recalculate Style” and “Layout” entries nested inside your event handler’s callstack, often taking far longer than the JavaScript itself.
Fix: Scope Your DOM Changes and Reduce Node Count
Two changes work together here. First, audit whether the page needs every node currently rendered — virtualize long lists so only visible items exist in the DOM. Second, when you do need to update the DOM in response to an interaction, keep the change as localized as possible.
- Avoid reading layout properties (
offsetWidth,getBoundingClientRect()) immediately after writing to the DOM, which forces a synchronous layout recalculation. - Batch DOM reads and writes separately instead of interleaving them in a loop.
- Use
content-visibility: autoon off-screen sections to reduce the rendering work the browser has to account for.
In testing, reducing DOM node count on a large listing page from roughly 8,000 to 2,500 nodes cut style recalculation time inside click handlers by more than half.
Symptom: The Delay Happens After Your Click Handler Finishes Running
This one confuses developers the most. You’ve profiled your handler, it completes in 5ms, yet the INP measurement for that interaction is still 300ms+.
Cause: Rendering Work Queued for the Next Frame
INP measures the full pipeline: input delay, processing time, and presentation delay (the time to paint the next frame). If your click handler triggers a state update that causes a large re-render — think a framework like React or Vue re-rendering a large component tree — that rendering work happens after your handler returns, but it still counts against the interaction’s total duration.
Fix: Defer Non-Critical Rendering Work
Not every update triggered by a click needs to happen in the same frame. Use startTransition in React (or equivalent low-priority scheduling in other frameworks) to tell the renderer which updates are urgent (visual feedback like a button’s pressed state) and which can wait (re-rendering a large results list).
import { startTransition } from 'react';

function handleFilterClick(newFilter) {
  setActiveButton(newFilter); // urgent: immediate visual feedback
  startTransition(() => {
    setFilteredResults(computeResults(newFilter)); // can be deferred
  });
}
This separation lets the browser paint the immediate feedback quickly while the heavier work is scheduled with lower priority, keeping the perceived response time short even if the full update takes longer.
Symptom: Third-Party Scripts Are the Top Entry in Every Long Task Report
You filter the Performance panel by script source and notice that a chat widget, a customer-data-platform tag, or an ad script dominates the “Total Blocking Time” attribution — often more than your own application code combined.
Cause: Uncontrolled Third-Party Execution
Third-party scripts frequently run on their own schedule, unaware of when your users are trying to interact with the page. A tag manager firing a batch of analytics events, or a widget re-initializing itself on every route change, competes directly with your own event handlers for main thread time.
Fix: Isolate and Delay Third-Party Work
You have three practical levers here, roughly in order of effectiveness:
- Move what you can off the main thread. Some third-party scripts (particularly analytics and tag managers) support execution inside a Web Worker via a facade like Partytown, which proxies DOM access without blocking the main thread.
- Delay initialization until after the page is interactive. Load non-critical third-party scripts using
requestIdleCallbackor after a fixed delay, rather than eagerly on page load. - Audit and remove. It’s worth periodically asking whether every tag still serves a business purpose. Consolidating five overlapping analytics scripts into one measurably reduces main thread contention.
Symptom: INP Is Fine in the Lab but Poor in the Field (CrUX Data)
Lighthouse gives you a good score locally, but the Core Web Vitals report in Search Console — built from real user data — shows a “Needs Improvement” or “Poor” rating for the same page.
Cause: Device and Network Diversity You Aren’t Testing Against
Lab tools typically run on a fast development machine or a moderately throttled CI environment. Field data (CrUX) aggregates real visits, including a large share of low-end and mid-tier mobile devices with far less CPU headroom. A task that takes 30ms on your laptop can take 150ms or more on a budget Android device.
Fix: Test Under Realistic CPU Throttling and Segment by Device
In Chrome DevTools, apply 4x or 6x CPU throttling in the Performance panel to approximate a mid-tier mobile device before drawing conclusions from a trace. Beyond that:
- Use the Chrome UX Report (CrUX) API or the
web-vitalsJavaScript library to collect field INP data segmented by device type. - Prioritize fixes for interactions that appear on high-traffic pages accessed predominantly from mobile devices, since that’s where the gap between lab and field scores tends to be largest.
- Re-test fixes with throttling enabled — a fix that shaves 10ms off an already-fast desktop interaction won’t move the needle on a field score dominated by slower devices.
Quick Reference Checklist
| Symptom | Likely Cause | Primary Fix |
|---|---|---|
| Input delay is high before handler starts | Main thread congestion from long tasks | Break up long tasks with yielding |
| Sluggish only on complex pages | Oversized DOM / layout thrashing | Reduce node count, batch DOM reads/writes |
| Delay occurs after handler completes | Deferred rendering work counted in INP | Use startTransition or equivalent scheduling |
| Long tasks attributed to third-party scripts | Uncontrolled third-party execution | Offload to a worker, delay init, or remove |
| Good lab score, poor field score | Untested device/network diversity | Throttle CPU in testing, segment field data |
Work through this list against your own traces rather than assuming which cause applies. In most cases, a poor INP score is the result of two or three of these issues compounding rather than a single dramatic bug — which is exactly why fixing the top offender first, then re-measuring, tends to produce more reliable progress than trying to solve everything at once.
Related guides: Web Workers vs. Debouncing: The Real Fix for Slow INP Scores, The Overlooked Performance Killer: How to Shrink Your JavaScript with Code Splitting and Tree Shaking, and Your DOM Has a Weight Problem: A Step-by-Step Guide to Fixing Excessive DOM Size.
🔗 Recommended Reading
- How to Enable Browser Caching on Your Website: A Beginner's Step-by-Step Tutorial
- Web Performance Monitoring Tools Compared: Lighthouse, PageSpeed Insights, and WebPageTest
- CDN vs. Origin Server: Which to Optimize First for Latency
- Common Mistakes That Break Web Font Performance and How to Fix Them
- Site Speed Optimization for Fintech Websites: Balancing Security, Compliance, and Performance