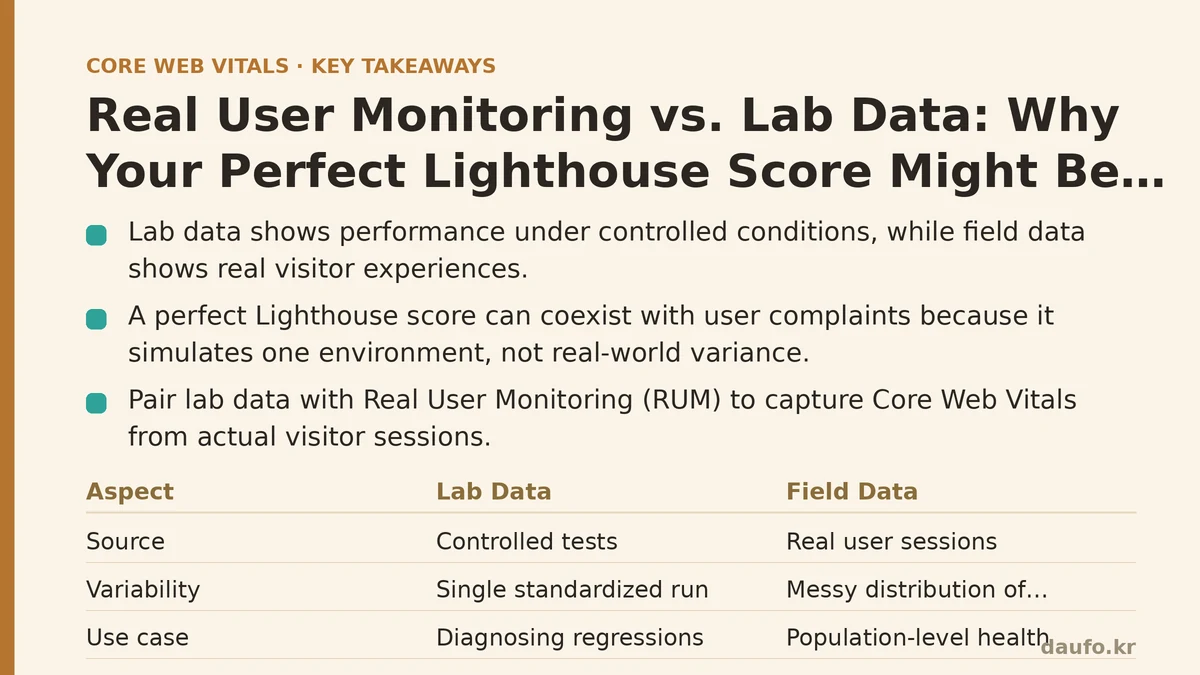
Lab data tells you how your site performs under controlled, ideal conditions. Field data tells you how it performs in the hands of an actual visitor on a cracked phone screen, spotty 4G, and twelve open browser tabs. Confusing the two is one of the most expensive mistakes a performance-conscious team can make, and a perfect Lighthouse score is often the exact moment that confusion sets in.
This post is structured as a troubleshooting guide. Each section starts with a symptom you’ve probably seen, walks through why it happens, and ends with a concrete fix you can apply this week.
Symptom: “Lighthouse says 100, but users are still complaining about slowness.”
You run PageSpeed Insights or Lighthouse in DevTools, get a green triple-digit score, and feel confident enough to close the ticket. Then support tickets or session recordings tell a completely different story: real visitors describe the site as sluggish, or your analytics show a high bounce rate on the exact pages you just “optimized.”
Cause: Lighthouse is a simulation, not an observation.
Lighthouse (and PageSpeed Insights’ lab section) runs your page in a single, standardized environment: a specific device emulation, a specific throttled network profile, and a single page load with no other tabs, extensions, or background processes competing for resources. It’s an excellent tool for catching regressions and diagnosing why something is slow, but it’s fundamentally a snapshot from one controlled test run, not a summary of what your users experience.
Your real audience is a messy distribution: some on flagship phones over fiber Wi-Fi, others on budget Android devices over congested cellular networks, many with ad blockers, browser extensions, or a dozen tabs open in the background. A single lab run cannot represent that spread, no matter how many times you re-run it.
Fix: Pair lab data with Real User Monitoring (RUM).
Set up a RUM tool that reports Core Web Vitals from actual visitor sessions. Options include the Chrome UX Report (CrUX), a self-hosted web-vitals JS library sending beacons to your analytics endpoint, or a commercial RUM platform. Treat Lighthouse as your diagnostic microscope and RUM as your population-level health chart. You need both, and they answer different questions.
Symptom: “Our CrUX data shows a ‘Poor’ LCP rating, but our lab tests are all green.”
This is the inverse problem, and it’s arguably more common than the first. The CrUX report in Search Console or PageSpeed Insights flags Largest Contentful Paint as needing improvement, based on 28 days of real visits, while your own Lighthouse runs consistently show LCP under 2 seconds.
Cause: You’re testing the wrong page, the wrong device, or the wrong network — and CrUX is aggregating everything.
A few things typically cause this gap:
- Page mismatch. You’re running Lighthouse against your homepage, but CrUX data (especially at the origin level) aggregates every URL on your domain, including a bloated product page or a legacy landing page nobody has touched in years.
- Device mismatch. Your test device emulation is a mid-tier Android profile, but a meaningful chunk of your real traffic comes from older, slower devices with weaker CPUs — and LCP timing is sensitive to main-thread contention during rendering.
- Network variance. Lab throttling profiles simulate a fixed “Slow 4G” or “Fast 3G” connection. Real 4G varies wildly by carrier, location, and time of day. A rural cell tower at rush hour behaves nothing like a lab simulation.
Fix: Segment your RUM data by URL, device class, and connection type before you draw conclusions.
Most RUM dashboards let you filter by page path, device category, and effective connection type. Find the specific segment driving the “Poor” rating rather than trying to fix the metric in aggregate. If it’s a specific page, audit that page directly in Lighthouse. If it’s a device class, throttle your lab tests to match that class’s CPU profile instead of the default.
Symptom: “Our Cumulative Layout Shift score is fine in testing, but the field data shows CLS spikes.”
CLS is deterministic in a controlled lab run because the page loads the same way every time. In the field, users interact with the page mid-load, scroll before images finish loading, or trigger dynamic content (cookie banners, ads, embedded widgets) that behaves differently depending on network timing.
Cause: Third-party scripts and late-loading content don’t behave consistently across real network conditions.
Ad slots, embedded social widgets, and A/B testing scripts frequently pull in content asynchronously. In a fast lab environment, that content might arrive early enough to reserve its space before the user notices. Under real-world network variance, the same script can resolve late, injecting content after the user has already started scrolling — producing a layout shift that never shows up in a five-second lab test.
Fix: Reserve space for dynamic content explicitly, and validate with field percentiles rather than a single test run.
Set explicit width and height attributes (or aspect-ratio in CSS) on any element that will be populated asynchronously, including ad containers and embeds. Once deployed, check the 75th percentile CLS value in your RUM tool specifically — Core Web Vitals thresholds are evaluated at the 75th percentile of real visits, not the average and definitely not your best lab run.
Symptom: “Performance looks great on desktop testing, but our mobile users are the ones filing complaints.”
Your CI pipeline runs Lighthouse with a desktop configuration, or your team primarily tests on office Wi-Fi with high-end laptops. Everything looks fast. Meanwhile, the majority of your traffic — and most of the complaints — comes from mobile.
Cause: Desktop and mobile lab configurations use different CPU and network throttling multipliers, and they rarely match your actual traffic mix.
Lighthouse’s mobile configuration applies a 4x CPU slowdown multiplier by default to approximate a mid-tier mobile device, alongside network throttling. If your team is testing with the desktop preset — or worse, with no throttling at all on a fast workstation — you are measuring a device and network profile that a large share of your visitors will never experience.
Fix: Match your lab testing configuration to your real traffic composition, using RUM data as the source of truth.
Pull your device and connection breakdown from analytics or your RUM tool. If 70% of sessions are mobile on 4G, that should be your primary lab testing profile, not an afterthought. Desktop testing still has value, but it shouldn’t be the number your team reports as “the” performance score.
Symptom: “We fixed the metric in the lab, shipped it, and RUM numbers didn’t move at all.”
A common and demoralizing pattern: you identify a lab bottleneck, ship a fix, verify it locally with a fresh Lighthouse run, and see the improvement — then check RUM dashboards a week later and see no meaningful change in the field percentiles.
Cause: The fix addressed a bottleneck that wasn’t actually the bottleneck for most real users.
Lab tests run against one URL, one session, one set of conditions. If the real-world bottleneck lives elsewhere — a slow third-party script that only loads for logged-in users, a font that only blocks rendering on certain browsers, a CDN edge location with degraded performance in one region — your lab-verified fix can be entirely correct and still invisible in aggregate field data.
Fix: Close the loop by measuring in the field, and be willing to revisit the diagnosis, not just the fix.
Deploy behind a feature flag or gradual rollout when possible, and compare RUM percentiles for the treatment group against a control group. If the numbers don’t move, the honest next step is questioning your original diagnosis rather than assuming the fix was ineffective. Lab tools point you toward plausible causes; only field data confirms which cause matters at scale.
Quick Reference: When to Use Which
| Question you’re asking | Use this |
|---|---|
| “Why is this specific page slow?” | Lab data (Lighthouse, WebPageTest) |
| “How are real users actually experiencing my site?” | Field data (RUM, CrUX) |
| “Did my fix work in principle?” | Lab data, as a first check |
| “Did my fix work for real users?” | Field data, as the final verdict |
| “Which page/device/region should I investigate first?” | Field data, to find the segment worth diagnosing |
| “What exact change should I make to that segment?” | Lab data, to isolate the cause |
Lab and field data aren’t competing sources of truth — they’re two instruments doing different jobs. Lighthouse tells you what’s technically possible to fix; RUM tells you whether it was worth fixing. The next time a dashboard shows a perfect score, ask a simple question before celebrating: perfect according to whom, and under what conditions? If you can’t answer that with field data, the score isn’t finished telling its story yet. Related guides: The Chrome UX Report Doesn’t Measure Your Users, and Other Truths About Field Data, Why Your Core Web Vitals Score Fluctuates: Troubleshooting Common Measurement Errors, and WebPageTest vs. Lighthouse: Choosing the Right Performance Testing Tool.
🔗 Recommended Reading
- How to Enable Browser Caching on Your Website: A Beginner's Step-by-Step Tutorial
- Web Performance Monitoring Tools Compared: Lighthouse, PageSpeed Insights, and WebPageTest
- CDN vs. Origin Server: Which to Optimize First for Latency
- Common Mistakes That Break Web Font Performance and How to Fix Them
- Site Speed Optimization for Fintech Websites: Balancing Security, Compliance, and Performance