The Chrome UX Report (CrUX) is the largest dataset of its kind, covering millions of origins. Yet for all its scale, it does not measure the experience of your specific users. It measures a carefully sampled subset of Chrome users who happen to visit your site on an opt-in basis. That distinction changes how you interpret every number in the report.
What CrUX does give you is a consistent, representative snapshot of how real devices, real networks, and real browsers experience your pages. It is ground truth for the aggregate, not for the individual. The practical question is not whether the data is perfect; it is whether you know how to read it for what it is.
This guide uses a checklist format, walking through common symptoms in CrUX data, what they point to, and the fixes that move the metrics that matter.
Symptom 1: Your Lab Tests Are Green, But CrUX Shows Red
You run Lighthouse in a clean Chrome instance on a wired connection. Your LCP is 1.8 seconds. Your INP is 120 milliseconds. Then you open CrUX and see LCP at 4.2 seconds and INP at 450 milliseconds. The gap looks like a data error. It is not.
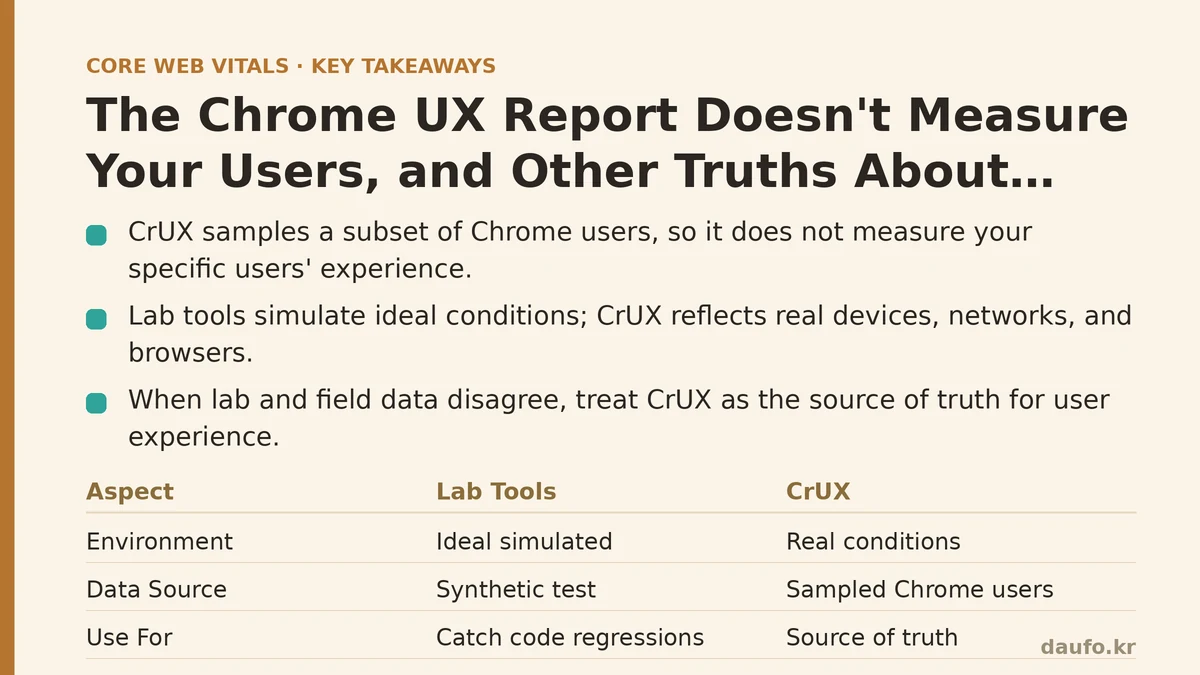
Cause: Lab tools simulate an ideal environment. CrUX reflects real conditions. Anything you control in a test — the hardware, the network speed, the lack of background processes, the absence of competing tabs — is different for a user on a mid-range Android phone connected to a congested 4G tower. The gap between lab and field is the gap between what is possible and what is typical.
Fix: Stop treating lab scores as targets. Use lab tools to catch regressions in code you control, but treat CrUX as the source of truth for user experience. When lab and field disagree, start with the field data. The next three symptoms will show you how to isolate the cause.
Symptom 2: The LCP Element Is “Obvious,” Yet LCP Is Slow
You know the largest element on your homepage is a hero image. It is optimized, compressed, and served from a CDN. LCP should be fast. In CrUX, it is not.
Cause: The LCP element is not always what you think it is. On a dynamic page, the largest paint can shift as resources load. A late-loading image or a web font that renders large text can become the LCP element halfway through the load. Also, the element that is largest in the lab on a desktop viewport is not necessarily the largest on a mobile viewport with a different layout. If you are optimizing the wrong element, your efforts will not show up in field data.
Fix: Open the CrUX record for your origin and look at the LCP distribution for mobile and desktop separately. Check your analytics or a field-based monitoring tool (like web-vitals library output) to see which element is reported as the LCP candidate on actual devices. If it is a background image or a CSS content image, that is a strong clue. Optimize that element specifically: preload it, resize it for each viewport, and ensure it is served with appropriate cache headers. Re-check CrUX after two weeks; the data lag is real.
Symptom 3: INP Is High, but You Have No Heavy JavaScript
You audited your bundles. You removed unused dependencies. Your main thread has very little script execution. Yet CrUX reports an INP in the “Needs Improvement” range.
Cause: INP measures the longest interaction on the page, from user input to the next paint. Slow interactions are not only caused by JavaScript. Long tasks can be triggered by layout thrashing from CSS, by large DOM sizes that make style recalculation expensive, or by font loading that shifts text and forces reflows. Also, the interaction might be happening on a page you did not expect, such as a product listing with many large images that trigger layout shifts while the user is trying to scroll.
Fix: Do not assume a JS problem. In the CrUX dashboard, segment INP by page type. Find the specific pages with the worst INP. On those pages, test with throttled CPU and a mid-range device profile. Observe the Performance panel for long tasks. If the tasks come from layout, reduce the DOM size, simplify CSS selectors, and add content-visibility: auto to off-screen sections. If the tasks come from event handlers, consider debouncing or deferring non-critical work until after the interaction.
Symptom 4: CLS Is Good on Mobile but Poor on Desktop
This asymmetry is more common than developers expect. Your mobile CLS is under 0.05, but desktop is at 0.25. You have not changed the layout in months.
Cause: Desktop viewports are wider. Ads, embedded videos, and other external content reserves space differently on wide screens. A banner that loads late and pushes content down will cause a larger visual shift on a large screen than on a phone where it is hidden. Also, desktop users often have multiple monitors and window sizes; a fixed-width layout that fits a 1440px screen may cause overflow and unexpected scrollbars at other widths.
Fix: Inspect the CLS breakdown for desktop. Look at the time-to-first-byte and the layout shift sources. Use the Layout Instability API in your monitoring to log the elements that shift. On desktop, give embedded content explicit dimensions, reserve space for late-loading banners with a fixed-height container, and verify your layout is responsive across common desktop resolutions, not just 1366x768. A single min-height on a wrapper can eliminate the shift entirely.
Symptom 5: Your CrUX Data Is Missing or Showing a “Not Enough Data” Error
You search for your origin and get nothing. The report says there is insufficient data. Your site has been live for months.
Cause: CrUX requires a minimum volume of traffic from opted-in Chrome users to build a report. For low-traffic sites, this threshold is often not met. Also, CrUX only covers origins with public access; a site behind a login is not eligible. The data is refreshed daily but aggregated over a 28-day window, so a site that was recently launched or recently migrated may not have enough cumulative data yet.
Fix: Accept the limitation and use alternatives. The CrUX History API can show you trends over a longer period if data exists. For short-term monitoring, use the web-vitals library on your own site to collect field data from all users, not just the opt-in Chrome sample. This gives you real-time visibility. If you are building a new site, do not wait for CrUX to validate it; use lab testing and your own field instrumentation. CrUX is a lagging indicator, and for small origins it may not be an indicator at all.
The Practical Checklist: What to Do Before You Panic
- Confirm the data window. CrUX is a 28-day rolling average. A change you made last week will not show yet. Wait two full weeks before judging an optimization.
- Segment by device. Mobile and desktop reports are separate. Optimize them independently; do not chase a blended score.
- Look at percentiles, not averages. The P75 value is the industry default for Core Web Vitals thresholds. A high average driven by a few extreme outliers does not tell you what typical users experience. P75 does.
- Check for a recent origin change. A redesign, a migration, or a change in hosting can invalidate your historical baseline. Compare current data to the previous 28-day window rather than to data from six months ago.
- Use the CrUX API for granular queries. The dashboard is useful, but the API lets you pull specific metrics for specific pages and devices. Automate a weekly check on your top ten pages.
- Fix the 90th percentile, not the median. The median user will be fine. The 90th percentile user is on an old device with a slow connection — exactly the user you lose to a competitor if your site is slow.
The Summary Table: Reading Your CrUX Report
| What You See | What It Means | First Action |
|---|---|---|
| LCP > 4s on mobile | Slow server response or large render-blocking resources | Test with a throttled 4G connection; optimize the LCP element specifically |
| INP > 500ms | Long tasks on the main thread (JS or layout) | Profile with Performance panel; reduce long tasks and DOM complexity |
| CLS > 0.1 on desktop only | Late-loading content shifting layout | Reserve space for ads, embeds, and banners with explicit dimensions |
| “Not enough data” error | Low traffic or private/authenticated pages | Use web-vitals library for your own user-level collection |
| P75 < threshold, P95 > threshold | Your optimization worked for typical users, but edge cases remain | Target the worst conditions; reduce the distribution tail |
The Chrome UX Report will not tell you what to fix. It will tell you where to look. The distinction is the difference between a quick fix and a real improvement. Treat CrUX as a compass, not a map: it points in the direction of the problem, and the rest of your tooling shows you the terrain. Start with the data, isolate the metric that is failing, and work backward to the code that causes it. The fix you find will be the one that matters.
Related guides: Core Web Vitals Are Not a Ranking Shortcut: What the Metrics Measure, Using Chrome UX Report (CrUX) Data to Benchmark Core Web Vitals, and Real User Monitoring vs. Lab Data: Why Your Perfect Lighthouse Score Might Be Lying to You.
🔗 Recommended Reading
- How to Enable Browser Caching on Your Website: A Beginner's Step-by-Step Tutorial
- Web Performance Monitoring Tools Compared: Lighthouse, PageSpeed Insights, and WebPageTest
- CDN vs. Origin Server: Which to Optimize First for Latency
- Common Mistakes That Break Web Font Performance and How to Fix Them
- Site Speed Optimization for Fintech Websites: Balancing Security, Compliance, and Performance