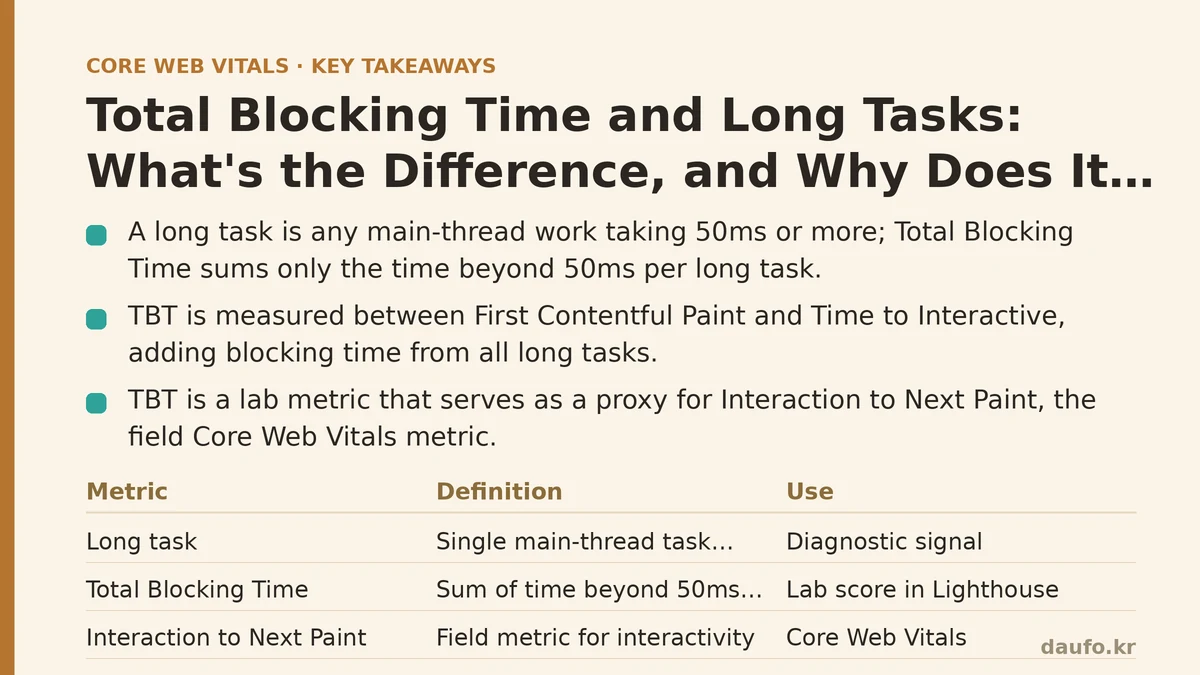
A “long task” is a raw event: a single, uninterrupted stretch of JavaScript execution on the main thread that runs for 50 milliseconds or longer. “Total Blocking Time” is a metric: the sum of everything that spills over from those long tasks, measured in a specific window between two other performance markers. One is a diagnostic signal from the browser. The other is a score you optimize for in Lighthouse. Confusing them is easy, and it leads people to chase the wrong number.
This post walks through the questions developers actually ask when they open a performance report and see “TBT: 890ms” staring back at them.
What counts as a “long task,” exactly?
The Long Tasks API defines a long task as any single piece of main-thread work that takes 50ms or more to complete without yielding. This includes JavaScript execution, style recalculation, layout, and other rendering work triggered synchronously by a script.
The 50ms threshold isn’t arbitrary. Human perception research generally places the limit for something to feel “instant” at around 100ms. Browsers reserve the first 50ms of that budget for the task itself and treat anything beyond that as time the user could have spent interacting with the page. So a task that runs for 200ms isn’t just “slow” — it’s actively stealing 150ms of responsiveness from the user.
Short tasks, even dozens of them back-to-back, don’t get flagged. The browser only cares about a single task exceeding the threshold, which is why breaking large operations into smaller chunks is such a common fix — more on that below.
So how does a long task turn into “Total Blocking Time”?
Here’s the calculation, stripped of jargon: for every long task, subtract the first 50ms (the “free” portion), and whatever remains is “blocking time” for that task. Add up the blocking time from every long task that occurs between First Contentful Paint (FCP) and Time to Interactive (TTI), and you get Total Blocking Time.
A concrete example makes this click faster than any definition:
Task A: 70ms  → 70 - 50 = 20ms blocking
Task B: 40ms  → below threshold, 0ms blocking
Task C: 200ms → 200 - 50 = 150ms blocking
Task D: 300ms → 300 - 50 = 250ms blocking

TBT = 20 + 0 + 150 + 250 = 420ms
Notice that Task B contributes nothing, even though 40ms isn’t instant either. TBT only penalizes tasks that cross the 50ms line, and only for the portion above that line.
Isn’t this just a fancier version of Time to Interactive?
Not quite, though the two are related. TTI marks the point where the main thread has been quiet enough, for long enough, that the browser considers the page reliably interactive. TBT measures the quality of everything that happened before that point.
Two pages can have identical TTI scores and wildly different TBT scores. One page might reach interactivity through a handful of short, well-behaved tasks. Another might get there via a few enormous scripts that each block the thread for hundreds of milliseconds. Both “arrive” at the same time, but a user trying to tap a button during that second page’s loading sequence will feel the difference immediately — taps get queued, animations stutter, and scrolling janks.
This is exactly why TBT exists as a lab metric proxy for Interaction to Next Paint (INP), the field metric that replaced First Input Delay in Core Web Vitals. TTI tells you when the page becomes usable. TBT tells you how painful getting there was.
Why should I care about TBT if INP is the real Core Web Vitals metric?
Because TBT is measurable in a lab environment, before your site ever ships to real users. INP is a field metric collected from actual visitor interactions via the Chrome User Experience Report, which means you only see it after the damage is done, and it can’t tell you which script caused the problem.
TBT, by contrast, shows up in every Lighthouse run and PageSpeed Insights report, tied directly to a trace you can inspect. High TBT during local testing is a strong leading indicator that INP will suffer in the field, particularly for users on mid-range mobile devices where CPU throttling amplifies every long task. Treat TBT as your early-warning system and INP as the real-world grade you’re studying for.
What actually causes long tasks in a typical app?
A handful of usual suspects show up in almost every trace:
- Large third-party scripts — tag managers, chat widgets, and ad tech that parse and execute in one uninterrupted block.
- Framework hydration — client-side frameworks re-attaching event listeners and rebuilding component trees on an already-rendered page.
- Heavy synchronous loops — sorting, filtering, or transforming large arrays of data on the main thread.
- Unoptimized event handlers — a scroll or resize listener doing expensive DOM reads and writes on every fire.
- Bundled JavaScript that isn’t code-split — one massive file means one massive parse-and-execute task instead of several smaller ones.
The common thread: none of these are inherently bad practices in isolation. The problem is running them as one monolithic block instead of breaking the work into pieces small enough to slip under the 50ms line.
How do I find long tasks in your own code?
Chrome DevTools’ Performance panel flags long tasks with a small red triangle in the top-right corner of each task bar in the timeline. Clicking into one shows you the full call stack, which usually points straight at the offending function.
For a programmatic approach, the PerformanceObserver API lets you catch long tasks in production:
new PerformanceObserver((list) => {
  for (const entry of list.getEntries()) {
    console.log('Long task detected:', entry.duration, entry);
  }
}).observe({ type: 'longtask', buffered: true });
This is worth wiring into your real user monitoring setup. Lab data tells you what happens on your test machine; this tells you what happens on your users’ actual, often underpowered, devices.
What’s the most effective fix once one has been found?
Break the task up. This is the single highest-leverage change you can make, and it works regardless of what’s causing the task.
The classic technique is yielding back to the main thread between chunks of work, so the browser gets a chance to handle input, paint, and other queued events:
function processInChunks(items, chunkSize = 100) {
  let index = 0;

  function runChunk() {
    const end = Math.min(index + chunkSize, items.length);
    for (; index < end; index++) {
      processItem(items[index]);
    }
    if (index < items.length) {
      setTimeout(runChunk, 0); // yield, then continue
    }
  }

  runChunk();
}
Modern browsers also support scheduler.yield() and the older isInputPending() API, both purpose-built for this exact scenario. For third-party scripts you don’t control, the fix is usually structural rather than code-level: load them with defer or async, delay them until after the main content is interactive, or move to a web worker where the API supports it.
Is there a target TBT score I should aim for?
Lighthouse treats a TBT under 200ms as good, 200–600ms as needing improvement, and anything above 600ms as poor. Those thresholds are useful as a sanity check, but they’re lab-environment numbers run on a simulated mid-tier device with throttled CPU — your real users’ distribution of devices will vary, sometimes significantly.
Treat the number less like a pass/fail gate and more like a diagnostic starting point. A page scoring 150ms TBT with three or four small long tasks is in a fundamentally different state than one scoring 550ms with a single 700ms script. Same rough score bracket, very different fix.
Where should you start?
Pull up a Lighthouse report on your slowest template, open the Performance panel, and look for the red triangles. Pick the largest one, trace it back to the function responsible, and ask whether it can be chunked, deferred, or moved off the main thread entirely. Fix that one task, re-run the report, and repeat. TBT rarely improves through a single sweeping change — it improves one long task at a time.
Related guides: HTTP Request Priority Isn’t What You Think: How Browsers Really Decide What Loads First, Animating with Intent: From Janky to Buttery-Smooth 60fps in a Real Dashboard, and Fixing Bad INP Scores: A Symptom-Cause-Fix Guide to Reducing Main Thread Work.
🔗 Recommended Reading
- How to Enable Browser Caching on Your Website: A Beginner's Step-by-Step Tutorial
- Web Performance Monitoring Tools Compared: Lighthouse, PageSpeed Insights, and WebPageTest
- CDN vs. Origin Server: Which to Optimize First for Latency
- Common Mistakes That Break Web Font Performance and How to Fix Them
- Site Speed Optimization for Fintech Websites: Balancing Security, Compliance, and Performance