After reading this post, you will be able to pull real field data from the Chrome UX Report (CrUX) for any public website and use it to set evidence-based Core Web Vitals targets, benchmark your site against competitors, and identify the specific percentiles where your performance falls short. You will gain a repeatable workflow for extracting this data, whether you prefer a quick API call or a deeper SQL query in BigQuery.
The Chrome UX Report is the definitive source of field performance data. It collects anonymized, opt-in data from real Chrome users, measuring the three Core Web Vitals (LCP, INP, FID) and supporting metrics like CLS and TTFB across millions of origins. Laboratory testing in tools like Lighthouse gives you a controlled snapshot, but CrUX tells you what your users are experiencing on their devices and networks. Benchmarking with CrUX moves you from guessing at performance targets to defining them from observed reality.
What You Will Be Able to Do
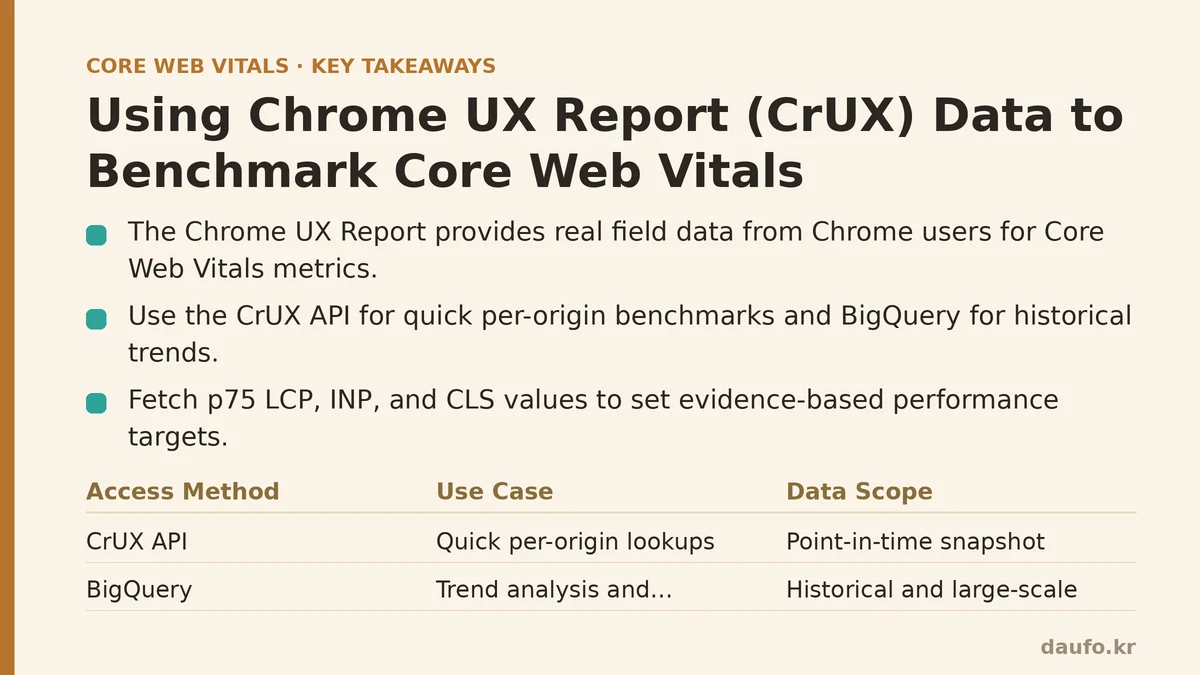
The CrUX dataset is exposed through two primary access points: the CrUX API (for quick, per-origin lookups) and the CrUX dataset on Google BigQuery (for large-scale analysis and historical comparisons). By the end, you will be able to:
- Fetch the 75th percentile (p75) LCP, INP, and CLS values for your origin.
- Compare your site against a competitor’s origin with a single API call.
- Write a BigQuery SQL query to track your performance trend over the past six months.
- Translate that data into a concrete, resettable performance budget for your development team.
The Beginner Path: Using the CrUX API for a Quick Benchmark
The CrUX API returns JSON, and you can query it directly from your browser or a terminal command like curl. This approach is perfect for a periodic, scripted health check.
Setup: Get a Free API Key
First, you need a Google Cloud project with the CrUX API enabled. This is a two-step process if you have never done it.
- Create a project in the Google Cloud Console.
- Enable the “Chrome UX Report API” for that project.
- Under “Credentials,” create an API key and restrict it to the CrUX API.
Once you have the key, the API endpoint is straightforward: https://chromeuxreport.googleapis.com/v1/records:queryRecord.
Change: Run the Benchmark Query
Here is a POST request body you can use to fetch data for your origin. You must specify a form factor and a metric based on your needs.
curl -X POST "https://chromeuxreport.googleapis.com/v1/records:queryRecord?key=YOUR_API_KEY" \
  -H "Content-Type: application/json" \
  -d '{
    "origin": "https://example.com",
    "formFactor": "PHONE",
    "metrics": ["largest_contentful_paint", "interaction_to_next_paint", "cumulative_layout_shift"]
  }'
Verify: Read the Response
The JSON response will contain the histogram buckets and, crucially, the percentiles object. Here is a condensed example:
{
  "record": {
    "key": { "origin": "https://example.com", "formFactor": "PHONE" },
    "metrics": {
      "largest_contentful_paint": {
        "percentiles": { "p75": 2500 }
      },
      "interaction_to_next_paint": {
        "percentiles": { "p75": 350 }
      },
      "cumulative_layout_shift": {
        "percentiles": { "p75": 0.05 }
      }
    }
  }
}
The p75 value is the metric you target. In this example, the p75 LCP is 2500ms, which sits exactly at the “Good” threshold. If your target is under 2.5 seconds, you have zero headroom. This single data point tells you your optimization priority: improve LCP.
To benchmark against a competitor, change the "origin" field value to their URL and run the identical curl command. You then have a direct, apples-to-apples comparison. The failure mode here is relying on this data during a period of low traffic. CrUX requires a minimum number of visits to publish data for an origin; a low-traffic new site may return no results.
The Advanced Path: Using BigQuery for Trend Analysis and Segmentation
The API gives you a point-in-time snapshot. For historical trends, cohort analysis, or querying across thousands of origins, you need the BigQuery dataset. Google publishes the CrUX table as a public dataset, and you can query it with their free 1TB-per-month tier.
Setup: Navigate the Table Structure
The dataset is updated monthly. The table schema includes columns like origin, form_factor, date (a structure with year and month), and a record column that contains nested metrics. The key is understanding that record is a STRUCT, not a flat table.
Change: Write a SQL Query for a 6-Month Trend
Instead of a simple lookup, let’s pull a trend for your origin. We want the p75 LCP for each of the last six months. The nested structure requires a UNNEST on the histogram bins and a bit of math to find the percentile.
SELECT
  date,
  form_factor.name AS form_factor,
  -- Find the p75 value from the LCP histogram
  percentile_75.value AS p75_lcp
FROM
  `chrome-ux-report.all.202501` -- This is the January 2025 table
  -- Repeat the month label manually from here for a range, e.g., all.202507
That approach requires six separate queries. A more efficient way is to use the unioned view, which Google provides. It spans all months. A single query can access all six months.
WITH crux_data AS (
  SELECT
    origin,
    date,
    form_factor.name AS form_factor,
    metric.percentile_75.value AS p75_lcp
  FROM
    `chrome-ux-report.unioned.2025` AS crux,
    UNNEST(crux.record.metrics) AS metric,
    UNNEST(metric.percentiles) AS percentile_75
  WHERE
    metric.name = 'largest_contentful_paint'
    AND origin = 'https://example.com'
    AND form_factor.name = 'phone'
    AND date.year = 2025
    AND date.month BETWEEN 1 AND 6
)
SELECT
  date,
  p75_lcp
FROM
  crux_data
ORDER BY
  date ASC;
This query yields a row per month, showing exactly how your LCP p75 has evolved. The trade-off here is query cost and complexity. The UNNEST operation on a large table can be expensive if you query without proper filtering. Always filter by origin or date in the WHERE clause to limit the data scanned.
Verify: Translate Data into a Budget
The output of the query is a raw dataset. The verification step is turning that into an action. For example:
If a p75 LCP trend is creeping upward over six months—for example, from around 2400ms toward 3000ms—that signals a regression problem. Your performance budget for new features must be zero, and you need to fix the regression first.
- If your p75 INP, as seen in the API response, is above 200ms, then the budget for your next feature sprint must include a specific allocation for splitting up long tasks.
When NOT to Use CrUX Data
CrUX is powerful, but it is not the right tool for every performance question. Do not use it for:
- Debugging a specific issue. If your LCP is high on a particular page, CrUX gives you the aggregate number, not the root cause. You still need the DevTools Performance panel to trace the request for the hero image.
- Testing a brand-new release. The data has a 28-day collection window. A change you ship today will not be reflected for at least a month. Use Lighthouse or WebPageTest in the interim.
- Low-traffic origins. If your site gets a few hundred visits a month, CrUX will often not have enough data to publish a p75 value. You will get errors like “origin not found.”
The analytical power of CrUX is best realized when you pair it with lab tools. The field data tells you what to fix (e.g., “INP is failing on mobile”), and the lab tools tell you where the fix goes (e.g., “the third-party widget on the product page is blocking the main thread”). In practice, the most effective performance engineers treat CrUX as a compass to point them in the right direction, not as a map showing every pothole.
Your next step is straightforward: open the API documentation, paste your origin into a curl command, and see what your real users are reporting. The result might justify your next optimization sprint or reveal that you have been polishing a part of the page that has no impact on your scores.
Related guides: The Chrome UX Report Doesn’t Measure Your Users, and Other Truths About Field Data, Core Web Vitals Are Not a Ranking Shortcut: What the Metrics Measure, and Real User Monitoring vs. Lab Data: Why Your Perfect Lighthouse Score Might Be Lying to You.
🔗 Recommended Reading
- How to Enable Browser Caching on Your Website: A Beginner's Step-by-Step Tutorial
- Web Performance Monitoring Tools Compared: Lighthouse, PageSpeed Insights, and WebPageTest
- CDN vs. Origin Server: Which to Optimize First for Latency
- Common Mistakes That Break Web Font Performance and How to Fix Them
- Site Speed Optimization for Fintech Websites: Balancing Security, Compliance, and Performance