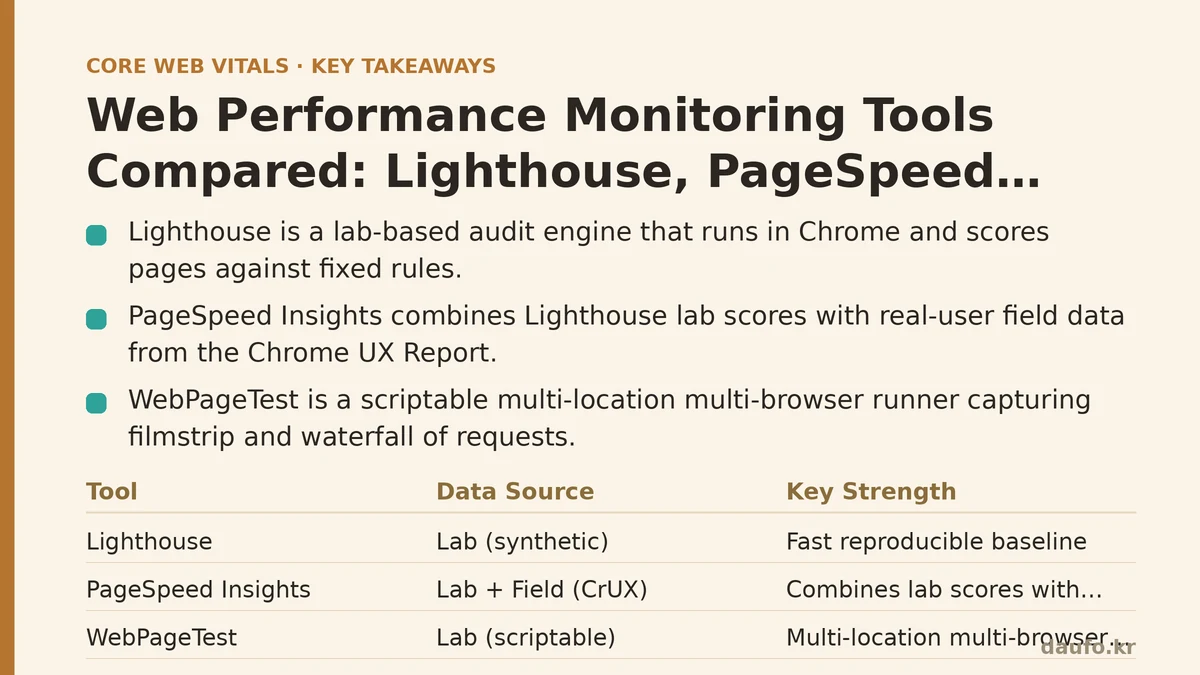
Web performance monitoring tools measure how fast and how reliably a page loads, but they do not all measure the same thing. Lighthouse is a lab-based audit engine that runs inside Chrome and scores a page against a fixed set of rules. PageSpeed Insights (PSI) wraps Lighthouse and combines its lab scores with real-user field data from the Chrome UX Report (CrUX). WebPageTest is a scriptable, multi-location, multi-browser test runner that captures a full filmstrip and waterfall of every request. Understanding those different data sources is what separates a useful measurement from a misleading one.
This article walks through a single concrete scenario — a slow product listing page on an e-commerce site — and shows how the three tools fit together at each stage: initial diagnosis, confirmation against field data, and deep investigation of a specific bottleneck. General guidance is woven into that walkthrough rather than listed separately.
The Starting Scenario: A Slow Category Page
Assume a developer or site owner is working on /products/shoes, a category page that lazy-loads a grid of product cards, ships a framework bundle, and pulls in a third-party review widget. Users report it “feels slow,” but no one has a number to point at. The goal is not to chase a single green score; it is to find the specific resource that is delaying the largest contentful paint and confirm that the fix will matter to real visitors.
Three complaints usually drive this kind of investigation:
- The page takes noticeably longer to show product images on mobile.
- Layout shifts as the review widget loads into place.
- Scores in different tools disagree, so nobody trusts the numbers.
Each tool answers a different part of that.
Stage 1 — Lighthouse for a Fast, Reproducible Baseline
Lighthouse is the lowest-friction starting point. It is built into Chrome DevTools (the Lighthouse panel), ships as a Node CLI, and runs in CI via @lhci/cli. It executes a synthetic page load under a throttled, emulated mobile profile, then produces five category scores and a list of opportunities.
The key mental model: Lighthouse numbers are lab data. They are deterministic enough to comparison-test a change, but they are not a prediction of what real users experience on their networks and devices. Treat the score as a regression gate, not as the truth about user experience.
Setup -> change -> verify
A minimal CLI run that writes a JSON report for a single URL:
# Install once, then audit a page with mobile emulation
npm install --save-dev lighthouse
npx lighthouse https://example.com/products/shoes \
  --only-categories=performance,accessibility,best-practices,seo \
  --form-factor=mobile \
  --throttling-method=simulate \
  --output=json \
  --output-path=./report.json \
  --chrome-flags="--headless --no-sandbox"
To pull the metrics you care about out of the JSON, use jq against the audits object. The metric keys Lighthouse emits are stable and worth knowing by name:
jq '{
  LCP:  .audits["largest-contentful-paint"].numericValue,
  CLS:  .audits["cumulative-layout-shift"].numericValue,
  TBT:  .audits["total-blocking-time"].numericValue,
  FCP:  .audits["first-contentful-paint"].numericValue,
  SI:   .audits["speed-index"].numericValue,
  score:.categories.performance.score
}' ./report.json
TBT (Total Blocking Time) is the important one here. It is a lab-only proxy for responsiveness, because Lighthouse cannot measure INP without a user. If TBT is high on this product page, the review widget or the framework bundle is likely blocking the main thread.
Where Lighthouse misleads
- Single-run variance. A single Lighthouse pass can swing several points between runs on the same URL. Run three times and compare the median before drawing conclusions.
- Simulated throttling. The default employs simulated throttling on a fast connection. It is not the same as a slow device on a poor network. Use
--throttling-method=devtoolsif you need a closer match, accepting that it will be slower and noisier. - It has no field data. A page can score 95 in Lighthouse and still fail Core Web Vitals for real users. Never treat a green Lighthouse score as proof of good field performance.
When not to rely on Lighthouse alone: any decision about whether real users are affected. That requires field data, which is where PSI comes in.
Stage 2 — PageSpeed Insights for the Field vs. Lab Split
PageSpeed Insights is the bridge. It runs a Lighthouse audit (lab) and pulls the latest 28-day summary of field data from the Chrome UX Report for that URL. The report deliberately separates the two panels, and the distinction is the whole point: field data tells you whether there is a problem, lab data tells you why.
On the product page, PSI might show field LCP as poor (above 4.0s, the “poor” threshold) while the Lighthouse lab LCP looks acceptable under a fast simulated profile. That gap is the signal: real users on mobile are hitting something the lab profile misses. PSI will also split field data by device class — mobile often tells a very different story than desktop — and by metric, so a page can pass CLS but fail LCP.
Reading the field-data thresholds
The Core Web Vitals field thresholds that PSI applies are fixed and worth memorizing, because every other tool will reference them:
| Metric | Good (pass) | Needs Improvement | Poor (fail) |
|---|---|---|---|
| LCP (Largest Contentful Paint) | ≤ 2.5 s | 2.5 – 4.0 s | > 4.0 s |
| INP (Interaction to Next Paint) | ≤ 200 ms | 200 – 500 ms | > 500 ms |
| CLS (Cumulative Layout Shift) | ≤ 0.1 | 0.1 – 0.25 | > 0.25 |
One practical caution: PSI field data is only available for URLs with enough traffic to appear in CrUX. Low-traffic pages, staging environments, and new pages return “no field data.” In those cases, PSI falls back to lab-only, and you must not read the absence of a field warning as proof that the page is fast. Origin-level CrUX data (aggregated across the whole site) can supplement page-level data, but it masks which specific URL is the problem.
What PSI cannot do: it will not tell you the exact request that is delaying LCP, and it does not let you script a multi-step user flow (login, add to cart, checkout). For that, the filmstrip and waterfall matter, and that is WebPageTest’s territory.
Stage 3 — WebPageTest for the Bottleneck Itself
If PSI’s field panel says LCP is poor and the Lighthouse filmstrip shows the product image arriving late, the next question is: which request is holding it up? WebPageTest answers that with a request waterfall, a visual filmstrip frame-by-frame, and the ability to test from specific geographic locations, browsers, and connection speeds. It also supports scripted runs with custom flows via its scripting language.
A minimal WebPageTest script that logs in, navigates to the category page, and captures the LCP element and a filmstrip:
// wpt-script.txt — run via the WebPageTest API or the "Advanced" tab
setEventName        Login
navigate            https://example.com/login
exec                document.querySelector('#user').value = 'test';
exec                document.querySelector('#pass').value = 'test';
submitForm          id=login-form

setEventName        CategoryPage
navigate            https://example.com/products/shoes
// wait for the LCP candidate to be reported, then stop
waitForMetric       LCP                30000
Running that script through the API (the pattern is close to what the public WebPageTest UI does under the hood):
curl -s -X POST "https://www.webpagetest.org/runtest.php?k=$WPT_API_KEY" \
  --data-urlencode "url=https://example.com/products/shoes" \
  --data-urlencode "script=$(cat wpt-script.txt)" \
  --data-urlencode "location=Dulles:Chrome.3G" \
  --data-urlencode "runs=3" \
  --data-urlencode "fvonly=1" \
  --data-urlencode "json=1"
The result gives you two things Lighthouse cannot: a waterfall that shows exactly where the LCP image request starts and what queued ahead of it, and a connection view that exposes DNS, TCP, and TLS time (relevant if a third-party origin is adding round trips). On the product page example, the waterfall commonly reveals that the LCP image is being loaded via loading="lazy" at the top of the viewport and is therefore deferred until layout calculates — a classic misconfiguration that neither Lighthouse’s score nor PSI’s field number will name for you.
Where WebPageTest is the wrong tool
- CI regression gates. WebPageTest runs are slower, queued, and not designed for per-commit gating. Use it for investigation, not for every pull request.
- First-pass triage on a new URL. The setup cost (location, browser, script) is higher than a single Lighthouse run. Start with Lighthouse; escalate to WebPageTest only when you need the waterfall.
- Anything requiring field data. WebPageTest is entirely synthetic. It will never tell you what your own users experience.
Putting the Three Tools Side by Side
The table below is the practical reference for choosing between them at each step of a real investigation.
| Dimension | Lighthouse | PageSpeed Insights | WebPageTest |
|---|---|---|---|
| Data type | Lab / synthetic | Lab + field (CrUX) | Lab / synthetic |
| Where it runs | Local Chrome, CLI, CI | Google-hosted service | Hosted test agents (many locations) |
| Core output | Category scores + opportunities | Field pass/fail + lab audit | Waterfall, filmstrip, connection view |
| Scriptable user flows | No (single URL) | No | Yes (WPT scripting) |
| Multi-location / device | Limited (emulation only) | Single region | Extensive |
| Best for | Fast baseline, CI gate | Confirming real-user impact | Isolating a specific bottleneck |
| Weakness | No field data; run variance | No waterfall; needs traffic | Queued; slow; synthetic only |
If a choice has to be made with limited time: use PSI to confirm the problem exists for real users, use Lighthouse to gate the fix in CI, and open WebPageTest only when the waterfall is needed to find the culprit. The product page case ends the same way it should for most sites: the LCP image was marked loading="lazy" above the fold, the review widget was blocking the main thread (high TBT), and the fix was two attribute and script-order changes — validated by a Lighthouse median of three runs, confirmed by a field-data improvement in PSI roughly a week after deployment.
A short checklist before trusting any of these numbers:
- Run Lighthouse three times and compare medians, not single passes.
- Confirm with field data (PSI/CrUX) before claiming a user-facing win.
- Use WebPageTest when the answer must be a specific request, not a score.
- Remember that a green lab score and good field data are different claims.
Related guides: WebPageTest vs. Lighthouse: Choosing the Right Performance Testing Tool, WebPageTest vs. Lighthouse: Choosing the Right Performance Tool for the Job, and Real User Monitoring vs. Lab Data: Why Your Perfect Lighthouse Score Might Be Lying to You.
🔗 Recommended Reading
- How to Enable Browser Caching on Your Website: A Beginner's Step-by-Step Tutorial
- CDN vs. Origin Server: Which to Optimize First for Latency
- Common Mistakes That Break Web Font Performance and How to Fix Them
- Site Speed Optimization for Fintech Websites: Balancing Security, Compliance, and Performance
- Core Web Vitals for Beginners: A Step-by-Step Guide to Measuring Your First Audit