You run Lighthouse, get a 95 performance score, push to production, and then a week later your monitoring tool reports slow LCP. Or the reverse: Lighthouse flags your site as slow, but real users seem fine. Which tool is right?
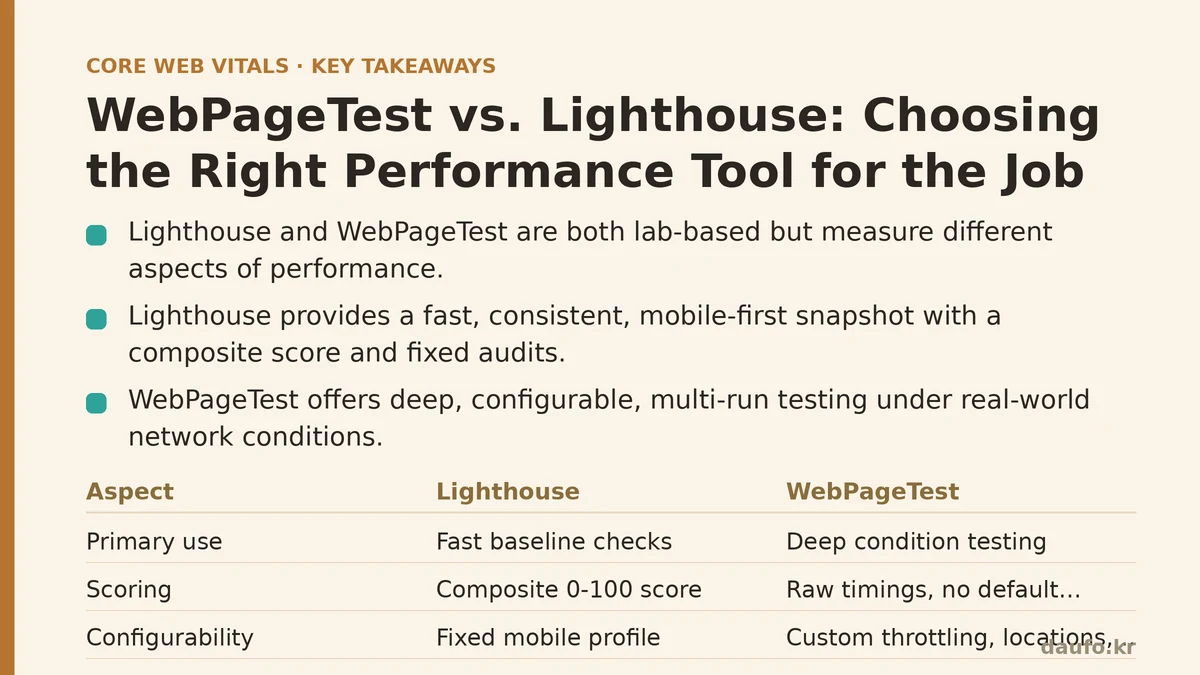
The short answer: both are right, and they’re measuring different things. WebPageTest and Lighthouse are both lab-based performance tools, but they exist for different jobs. Lighthouse gives you a fast, consistent, mobile-first snapshot against a fixed set of audits. WebPageTest gives you deep, configurable, multi-run testing against real-world network conditions with a level of detail Lighthouse never exposes. Choosing one over the other means leaving blind spots in your performance workflow.
This guide walks through the decision process step by step, shows you how to combine them, and explains how to interpret the cases where they disagree.
Step 1: Understand What Each Tool Measures
Before you pick a tool, you need to know what the scores you’re looking at represent.
Lighthouse runs on a single viewport (default 412x823 px, a mid-range mobile device emulation), uses a simulated 4G throttle (1.6 Mbps down, 150 ms RTT), and applies CPU throttling to emulate a mid-tier Android device. It computes a weighted composite score from six categories—Performance, Accessibility, Best Practices, SEO, and PWA—with Performance meta-metrics like FCP, LCP, TBT, and CLS feeding into the final 0–100 Performance score.
Lighthouse answers the question: Does my page meet a baseline set of performance and quality standards?
WebPageTest answers a different question: How does this page behave under specific network, device, and geography conditions? It runs real Chrome instances (or other browsers) on real hardware, lets you choose from dozens of preset throttling profiles (e.g., “Mobile 3G - Fast”, “Cable”, “4G”), lets you set custom connection speeds, and can run from test locations worldwide. It also supports multi-step transactions (log in, click through, measure a post-login page) and video capture for filmstrip and visual comparison.
WebPageTest does not produce a single composite score by default. Instead, it gives you raw timings—LCP, TBT, CLS, speed index, TTFB—plus a waterfall, a filmstrip, and a breakdown of which phases consumed the most time. There’s a Lighthouse tab inside WebPageTest that runs a Lighthouse audit under the conditions you configured.
Step 2: Use Lighthouse for Fast, Consistent Baselines
Lighthouse shines when you need a repeatable, comparative baseline. That’s why it’s embedded in Chrome DevTools, PageSpeed Insights, and CI/CD pipelines.
Setup path:
- Install Lighthouse as a Node package:
npm install -g lighthouse - Run a single audit:
lighthouse https://example.com --preset=desktop --output=json --output-path=./lh-desktop.json - For mobile, omit the preset (default is mobile) or explicitly specify it:
lighthouse https://example.com --preset=desktop --output=json --output-path=./lh-mobile.json - For CI, add Lighthouse CI to your workflow:
npm install -g @lhci/cli
lhci collect --url=https://example.com --numberOfRuns=3
lhci assert --preset=lighthouse:recommended
Why Lighthouse works well for this:
- Deterministic throttling. The simulated 4G throttling means every run is comparable to every previous run, regardless of your machine’s network.
- Fast. A single mobile run takes 20–40 seconds, so you can run it dozens of times without significant cost.
- Structured audits. The 100-point scores and category breakdowns give you a clear, if sometimes blunt, indicator of regressions.
- CI-friendly. It exits with a non-zero code if your performance budget is exceeded, which you can hook into any CI system.
Its limits:
- One viewport, one throttle. Lighthouse assumes a single mobile profile. If your audience is mostly desktop on fast connections, the mobile run will tell you about scenarios your users hit rarely.
- No real hardware. The CPU throttle is a simulation; it won’t reveal thermal throttling, or how the page runs on an actual low-end Android.
- Single-page focus. Lighthouse only measures the initial page load. It cannot measure multi-step flows or a SPA route change.
Step 3: Use WebPageTest for Deep Diagnosis and Realistic Conditions
When Lighthouse tells you something is wrong but you can’t see where, or when you need to understand how a specific user segment experiences your site, WebPageTest is the tool you reach for.
Setup path (free tier):
- Go to webpagetest.org.
- Enter your URL.
- Choose test location (e.g., Dulles, VA; Mumbai; Sydney).
- Choose browser (Chrome, Firefox, Safari).
- Choose connection speed (e.g., “Mobile 4G - 9 Mbps/4 Mbps/170ms RTT”).
- Run the test. Review the waterfall, filmstrip, and individual timings.
For programmatic use, there’s an API:
curl -X POST "https://www.webpagetest.org/runtest.php" \
  -H "Content-Type: application/x-www-form-urlencoded" \
  -d "url=https%3A%2F%2Fexample.com" \
  -d "location=Dulles:Chrome" \
  -d "runs=3" \
  -d "f=json" \
  -d "k=YOUR_API_KEY"
Why WebPageTest excels here:
- Real network conditions. Choose “Mobile 3G - Fast” and you’re emulating a genuine 1.6 Mbps link with 300 ms RTT, not a simulation.
- Real devices. You can test physical Android and iPhone devices through options like “Mobile - Android” and “Mobile - iPhone” in some locations.
- Multiple runs. By default it runs 3–9 tests and reports the median, giving you statistically meaningful numbers rather than a single sample.
- Waterfall and filmstrip. The waterfall shows exactly when each resource started, how long it waited on the network, and what blocked it. The filmstrip shows a visual timeline of the page rendering frame by frame.
- Multi-step scripts. You can script a login flow, measure a checkout page, or run a repeat-view test for cache validation.
Its limits:
- No composite score. You get raw data, which means you need to interpret it yourself. That’s a feature, but it adds effort.
- Slower and more expensive. A single test with 3 runs can take several minutes. At scale you’ll pay for API access.
- Less deterministic. Real network conditions vary between runs, even from the same location. This is why WebPageTest defaults to multiple runs and reports the median.
Step 4: Reconcile the Scores When They Disagree
Here’s a scenario you’ll encounter: Lighthouse says Performance = 98 for a mobile run on a simulated 4G connection. You hand that same URL to WebPageTest, set it to “Mobile 4G - Fast” (9 Mbps/4 Mbps/170 ms RTT), and it reports an LCP of 4.2 seconds. Both tools ran a test. Why the massive gap?
Reason 1: Different throttling profiles.
Lighthouse’s “Mobile 4G” is not real 4G. It’s a simulation of a slow 1.6 Mbps connection with higher CPU throttling than you’d find on any modern phone. In practice, this makes Lighthouse far more punishing than WebPageTest on CPU-heavy sites (heavy JavaScript, complex rendering). WebPageTest’s same-named profile uses a faster 9 Mbps link, so its raw timings will often be better.
Reason 2: Different CPU emulation.
Lighthouse throttles the CPU by 4x on mobile. WebPageTest, depending on location, may run on a fast desktop machine with a software throttle, or on a real device. In testing, a site heavy on JavaScript synthesis will always look worse in Lighthouse.
Reason 3: DNS and TTFB differences.
WebPageTest with a real DNS lookup from a specific location will include real DNS time, real TLS negotiation, and real server response time. Lighthouse simulates the connection but still runs against your live server, so TTFB is real—but the throttle model can mask server-side latency.
What to do when they disagree:
- Trust Lighthouse for trend detection. If Lighthouse scores drop from 98 to 85 between two commits, that’s a real regression—your code changed something. Hunting the exact cause is where WebPageTest comes in.
- Trust WebPageTest for the user experience. If WebPageTest says LCP is 4.2 seconds under “Mobile 4G - Fast,” your users on real 4G will experience something close to that number. Lighthouse would likely give you a lower LCP for the same page on the more punishing profile.
- Use the waterfall to explain your Lighthouse score. When Lighthouse flags high TBT, WebPageTest can show you the exact long tasks in the main thread—the waterfall’s “Main Thread” column exposes them.
- Never compare absolute numbers across tools. Always compare relative deltas: before/after changes, or your site vs. a competitor run on the same tool and profile.
Step 5: Build a Combined Testing Workflow
A performant site requires both fast feedback in development and realistic verification in production. Here’s a workflow that uses each tool where it earns its keep.
Phase 1: Development (per commit)
Run Lighthouse CI on every pull request. Set performance budgets (e.g., LCP < 2.5 s, TBT < 200 ms, CLS < 0.1) and fail the build when they’re violated. This gives you immediate, deterministic feedback.
# .lighthouserc.json
{
  "ci": {
    "collect": {
      "url": ["https://example.com"],
      "numberOfRuns": 3
    },
    "assert": {
      "assertions": {
        "largest-contentful-paint": ["error", {"maxNumericValue": 2500}],
        "total-blocking-time": ["error", {"maxNumericValue": 200}],
        "cumulative-layout-shift": ["error", {"maxNumericValue": 0.1}]
      }
    }
  }
}
Phase 2: Staging (per feature merge)
Run WebPageTest from 2–3 locations (e.g., North America + EU + Asia) with your primary user profile. Use the API or the CLI tool wpt-cli to automate this:
npm install -g wpt-cli
wpt https://staging.example.com --location Dulles:Chrome --runs 5 --throttle "4G" --timeout 180
Look at the median results for LCP and TBT. Compare to your baseline from the previous release. This is the test that catches issues Lighthouse misses: real network variance, resource timing issues, CDN edge behavior.
Phase 3: Continuous monitoring (production)
Lighthouse is too heavy to run continuously. Instead, use a RUM (Real User Monitoring) tool like CrUX API or your own analytics to track real Core Web Vitals. When CrUX reports a regression, go back to Step 1 and run a full Lighthouse + WebPageTest audit to diagnose the cause.
One warning: don’t put WebPageTest in your CI. It’s too slow and too variable. Use it as a periodic verification layer and a debugging tool, not a gate.
Step 6: Avoid the Common Pitfalls
Pitfall 1: Over-optimizing for one tool’s score.
Lighthouse’s simulation punishes JavaScript execution far more than real devices do. If you chase a 100 Lighthouse score by gutting every script, you might remove functionality for no real user benefit. Set budgets that reflect your actual user conditions, not the tool’s idealized profile.
Pitfall 2: Running Lighthouse on a misconfigured machine.
If your dev machine has a slow CPU, Lighthouse’s simulation compounds with real hardware slowness. Run Lighthouse on a known baseline (a dedicated runner or GitHub Actions) so comparisons are valid.
Pitfall 3: Ignoring WebPageTest’s “Repeat View” tab.
The default tab is the first load. The repeat view shows what a returning user experiences after browser caching. If your repeat view LCP is worse than your first view, you have an aggressive cache-busting problem or you’re not setting cache headers. WebPageTest surfaces this automatically; you need to look at it.
Pitfall 4: Using WebPageTest without multiple runs.
A single run is a single sample of a noisy network. Always request at least 3 runs (the default is 3–9) and report the median.
Summary: Which Tool Do You Need?
| Tool | Best For | Not For | Composite Score? | Throttling Model |
|---|---|---|---|---|
| Lighthouse | Regression testing, CI gates, baseline audits, budget enforcement | Diagnosing specific resource timing issues, multi-step flows, real-world conditions | Yes (0–100) | Simulated (fixed 4G, CPU throttle) |
| WebPageTest | Deep diagnosis, waterfall analysis, test against specific networks/regions, multi-step scripts, multi-run median metrics | Fast per-commit feedback, automated budgets | No (raw timings) | Real network profiles (variable locations) |
Start with Lighthouse in your CI. When the site meets your budgets there, run WebPageTest from a real-world location to confirm the user experience. When scores from the two tools diverge, use the waterfall to understand why. You need both tools in your toolbelt—they answer complementary questions about the same page.
Run a comparison of your own landing page in both tools today. Look at the waterfall in WebPageTest and see if the LCP resource is the one Lighthouse is flagging. In practice, one of those two tools will show you something you didn’t know about your page.
Related guides: WebPageTest vs. Lighthouse: Choosing the Right Performance Testing Tool, Performance Budgets, Ranked: The 5 Metrics Worth Enforcing (and How to Do It), and Real User Monitoring vs. Lab Data: Why Your Perfect Lighthouse Score Might Be Lying to You.
🔗 Recommended Reading
- How to Enable Browser Caching on Your Website: A Beginner's Step-by-Step Tutorial
- Web Performance Monitoring Tools Compared: Lighthouse, PageSpeed Insights, and WebPageTest
- CDN vs. Origin Server: Which to Optimize First for Latency
- Common Mistakes That Break Web Font Performance and How to Fix Them
- Site Speed Optimization for Fintech Websites: Balancing Security, Compliance, and Performance